Via The Conversation, a report on how satellite data provides fresh insights into the amount of water in the Nile basin:
Flowing through 11 African countries, the Nile River plays an important role in the lives of more than 24% of Africa’s population. To both upstream and downstream countries, the Nile waters are crucial in development planning, food and energy production.
As countries vie for these resources, there has been immense tension. Most notably, Egypt and Sudan have challenged Ethiopia’s decision to construct and fill the Grand Ethiopian Renaissance Dam. This is a huge project on one of the Nile’s main tributaries, the Blue Nile, which supplies more than 80% of the water reaching Egypt.
Treaties are needed to govern the allocation of water resources in the region. For this to happen it is critical to have accurate data on how much water there is. But global water scarcity data are based on insufficient ground observations. They are grossly outdated and don’t cover enough of the major transboundary river basins. This is due to funding, maintenance cost, terrain and topography. In the Nile basin, hydrological monitoring stations have significantly declined in number over the last 30 years.
But this is changing. Recent advances in hydrological satellite observations are enabling the frequent collection of much more reliable information. This has opened the door to new research efforts to update global water availability.
Hydrological satellite observations happen when a satellite – hundreds of miles away from the Earth’s surface – observes and makes recurring visits to the same site several times a month. One of these – which allows for improved assessment of the total changes in water volume – is NASA’s joint satellite mission Gravity Recovery and Climate Experiment.
Our research team is among the first to use data from this satellite mission for a water scarcity assessment in Africa. We have used the data in several studies of the Nile basin. This includes assessments into how water levels in the Nile Basin are affected by the climate and people.
The data has enabled us to make accurate calculations that weren’t possible before. For example, we have been able to assess how much surface water there is and what the soil moisture and levels of groundwater are. Previous studies focused primarily on one or some of those variables, such as the water from the river flow.
Our study shows that there’s a looming water crisis in the Nile basin. This calls for an urgent regional basin initiative on sustainable water resources management.
We used these observations to determine the total available water storage in the Nile basin between 2002 and 2020. Overall, the data revealed that the total available water storage in the basin, from all sources, could reach an average of 180 billion cubic metres per year. This estimate is about twice the current estimated storage of 88 billion cubic metres per year. Having data like this would inform how much water is allocated in the basin’s water sharing agreements.
We also used the satellite data to estimate the total available water storage for two main water tower regions (the source of the river) – Lake Victoria and the Blue Nile basin – and two major water sink regions (where slow flowing water is lost to evaporation) – the Sudd wetlands in South Sudan and the Main Nile area across Egypt.
From what was previously reported, recent Gravity Recovery and Climate Experiment satellite observations showed that the Lake Victoria water tower receives about twice the water volume that the Blue Nile basin receives during the wet season. And the Sudd basin (the southern water sink) loses about twice the water compared to the northern Main Nile region.
These updated figures call for progressive water resources planning to save additional water resources for future development in the region.
The satellite observations also confirmed that between 2002 and 2020, the Nile river basin experienced wetter conditions. In 2020, the Nile river basin had approximately eight times more water storage than it did in 2002. These wetter conditions require further planning for more water volumes during flooding seasons.
Despite this, our conclusion confirms previous assessments that the basin is water-stressed.
Water stressed
A region is said to experience water-stress if the available water to use per person per year – for indoor, agricultural and industrial needs – is less than 1000 cubic metres a year, approximately 1,000,000 litres per person per year.
For daily basic needs, a person uses approximately 150 litres a day. In Egypt (a major receiver of the Nile’s water), a person uses about 200 litres on average for domestic water needs per day. However, agriculture needs – such as food production – require between 2,000 and 5,000 litres of water per day.
If the available water to use becomes less than 500 cubic metres a year – about 500,000 litres of waters per person per year – to meet all water demands, a region is under absolute water scarcity conditions.
Because of the current and booming population projections – the basin’s population is projected to reach 800 million by 2050 – the basin is under severe water stress conditions.
To estimate the yearly available water per capita we need to divide the total available water in the region – which we found to be 180 billion cubic metres per year – by total population. We therefore estimated that the available water to use per capita is approximately 450 cubic metres a year, or approximately 1,230 litres per person a day. But there is an important caveat; the total amount of available water cannot all be extracted and used due to technological and economic constraints. Therefore, the true amount of usable water is likely considerably less than 1,230 litres per person per day.
More than ever before, riparian nations need to reinforce agreements on future water planning and new water sharing policies.
Data to the rescue
It won’t be easy to get the 11 countries in the basin to agree to a water sharing plan to avoid chronic water shortages in the future. But key to ensuring cooperation is good information sharing and technical cooperation between the riparian states.
Having accurate information on the available water will improve the understanding of common water resources and promote confidence between the basin states.
,
Read More » Posted in Satellite, Water | Comments Off on Satellite Data Provides Fresh Insights Into Amount of Water In Nile Basin
Via Terra Daily, an interesting look at how satellite data is transforming water management:
Building upon more than two decades of research, a new web-based platform called OpenET will soon be putting NASA data in the hands of farmers, water managers and conservation groups to accelerate improvements and innovations in water management. OpenET uses publicly available data and open source models to provide satellite-based information on evapotranspiration (the “ET” in OpenET) in areas as small as a quarter of an acre and at daily, monthly and yearly intervals.
Evapotranspiration is the process by which water is transferred from the land to the atmosphere, by water leaving the soil (evaporation) and water lost through plant leaves and stems (transpiration). Evapotranspiration is an important measure of how much water is used or “consumed” by agricultural crops and other plants.
In the arid western United States, where the majority of water used by people is for irrigation to grow crops, having an accurate measure of evapotranspiration is critical to balancing water supplies and water demand. Until OpenET, there has not been an operational system for measuring and distributing evapotranspiration data at the scale of individual fields across the western United States. OpenET will be available to the public next year, supplying evapotranspiration data across 17 western states.
“What OpenET offers is a way for people to better understand their water usage and, more importantly, their water loss through evapotranspiration,” said Denise Moyle, an alfalfa farmer in Diamond Valley, Nevada, and an OpenET collaborator. “Giving farmers and other water managers better information is the greatest value of OpenET.”
The OpenET platform is being developed through a unique collaboration of scientists, farmers and water managers from across the western United States, as well as software engineers specializing in data access and visualization for large Earth observation datasets.
Led by NASA, the nonprofit Environmental Defense Fund (EDF), the Desert Research Institute (DRI) and data applications developer HabitatSeven, with funding from the Water Funder Initiative and in-kind support from Google Earth Engine, OpenET primarily uses satellite datasets from the Landsat program, which is a partnership between NASA and the U.S. Geological Survey (USGS). Additional data comes from NASA’s Terra and Aqua satellites, the National Oceanic and Atmospheric Administration (NOAA) GOES series of satellites and others.
“OpenET will empower farmers and water managers across the West to build more accurate water budgets and identify stress, resulting in a more resilient system for agriculture, people and ecosystems,” said Maurice Hall, head of EDF’s Western Water program. “We envision OpenET leveling the playing field by providing the same trusted data to all types of users, from the small farmer to regional water planners.”
California’s Delta Watermaster Michael George is responsible for administering water rights within the Sacramento-San Joaquin River Delta, which supplies drinking water to more than 25 million Californians and helps irrigate 3 million acres of farmland. For him, the development of OpenET signals an exciting opportunity for the future of water in the West.
“OpenET represents a game-changing leap forward for water management,” George said. “It will help landowners and water managers in the Bay-Delta save millions of dollars that would otherwise have to be spent on water meters to more accurately measure water use, as required by state law.”
In addition to helping Delta farmers save costs, OpenET data will improve water management in the area, according to Forrest Melton, program scientist for NASA’s Western Water Applications Office. He is also with the NASA Ames Research Center Cooperative for Research in Earth Science and Technology (ARC-CREST).
“The importance of careful, data-driven water management in the Delta and other regions can’t be overstated,” he explained. “In addition to supplying water for drinking and growing food, the Delta provides critical habitat for endangered species. For a water manager, trying to balance all of these demands is almost impossible without accurate, timely data.”
The OpenET team is currently collaborating with water users on several case studies across the West. In California’s Central Valley, the Rosedale-Rio Bravo Water Storage District is already starting to use OpenET data as the foundation for an online water accounting and trading platform to help farmers in the district manage groundwater sustainably. In Colorado, high-altitude ranchers will be using OpenET as they experiment with different irrigation strategies to conserve water.
Landsat science team member Justin Huntington of DRI emphasized the value of getting this type of early feedback on the OpenET system from future users. “Working closely with farmers and water managers on the design of OpenET has given us invaluable insights into how to best make ET data available to support water management in Diamond Valley and other basins across the West,” he said.
Because the OpenET system uses open source software and open data sources, it will help water managers establish an agreed upon measure of evapotranspiration across agricultural areas, said Melton. Different estimates of evapotranspiration have previously been a source of confusion for water managers, he said, explaining that water users and managers currently have to evaluate a variety of methodologies to measure water use and evapotranspiration, which often leads to different numbers and debates over accuracy.
OpenET provides a solution to those debates, said project manager Robyn Grimm. “OpenET brings together several well-established methods for calculating evapotranspiration from satellite data onto a single platform so that everyone who makes decisions about water can work from the same playbook, using the same consistent, trusted data,” said Grimm, who is also a senior manager at EDF.
The need for a resource like OpenET is also pressing beyond California and across the American West, Melton said.
“Our water supplies in the West are crucial to providing food for the country and beyond, and yet these supplies are under increasing levels of stress,” Melton said. “OpenET will provide the data we need to address the challenge of water scarcity facing many agricultural regions around the world and ensure we have enough water for generations to come.”
,
Read More » Posted in Satellite, Water | Comments Off on Transforming Water Management In The US West With NASA Data
Via McKinsey, a look at how advanced analytics may help struggling fisheries thrive while simultaneously protecting endangered ocean resources:
At restaurants and dinner tables around the world, seafood is often the entrée of choice. Fish, crustacean, and mollusk consumption account for about 17 percent of the world’s total animal protein intake, with much of this coming from the ocean. Fish and shellfish are especially important in low-income areas where total protein intake is low and diets are less diversified.
Fishing companies—businesses that catch fish or other seafood in the wild—will play a major role in sustaining food security and supporting fishing communities. But in their quest to capture enough fish to satisfy soaring demand, they are exerting unprecedented pressure on marine and freshwater ecosystems. It now takes five times the effort (in kilowatt-hours) to catch the same amount of fish as it did in 1950, because the targeted species are now in scarce supply.1 This shortage not only jeopardizes commercial prospects for fishing companies but also greatly threatens the ability of endangered ocean species to reproduce and maintain their numbers.
Balancing fishery interests with environmental concerns is not easy, but advanced analytics (AA)—the use of sophisticated methods to collect, process, and interpret big data—might represent an untapped solution to this problem. While fishing companies, regulators, and environmentalists now apply these tools, their use is typically limited to small-scale pilots. But we may have reached the point where advanced analytics will take off within the fishing sector. In addition to the development of new technologies that support analytics in this field, both policy makers and fishing-company leaders have an increased sense of urgency because of dwindling fish stocks. Further, people entering the fishing industry or participating in regulatory development are more tech savvy than their predecessors, giving them a greater understanding of advanced analytics and other digital tools. Even fishermen from emerging markets can access information on these technologies—and their benefits—through a simple smartphone search.
The growth of advanced analytics could promote the development of precision fishing—the use of advanced tools and technologies to optimize fishing operations and management. If large-scale fishing companies around the world move to this model, they could decrease their annual operating costs by about $11 billion, and customers would benefit from lower prices for fish and seafood. Precision-fishing techniques can also contribute to improved management of ocean resources, which could increase industry profits by as much as $53 billion by 2050 while simultaneously raising the total fish biomass to at least twice the current level.2
This article attempts to paint a picture of the current situation in the fishing industry, focusing on the challenges that are making it more urgent to adapt advanced analytics and associated tools. It also discusses several of the most popular use cases that have emerged for advanced analytics, as well as others that show great potential. Finally, the article provides a practical guide to next steps for all industry stakeholders.
The appetite for tuna, salmon, shrimp, and other ocean creatures is nothing new. Demand has increased an average of 3.2 percent annually between 1961 and 2016—more than twice the 1.6 percent rate of population growth over the same period and higher than the 2.8 percent rise in consumption of terrestrial mammals.3 Overall, the world’s fish consumption is predicted to increase by 20 percent from 2016 to 2030, driven by global population growth, the expansion of the middle class, and greater urbanization (giving more people more access to seafood, as well as the electricity and refrigeration needed to store it). Consumers also increasingly prefer healthy food choices, and many view fish as a good alternative to red meat.
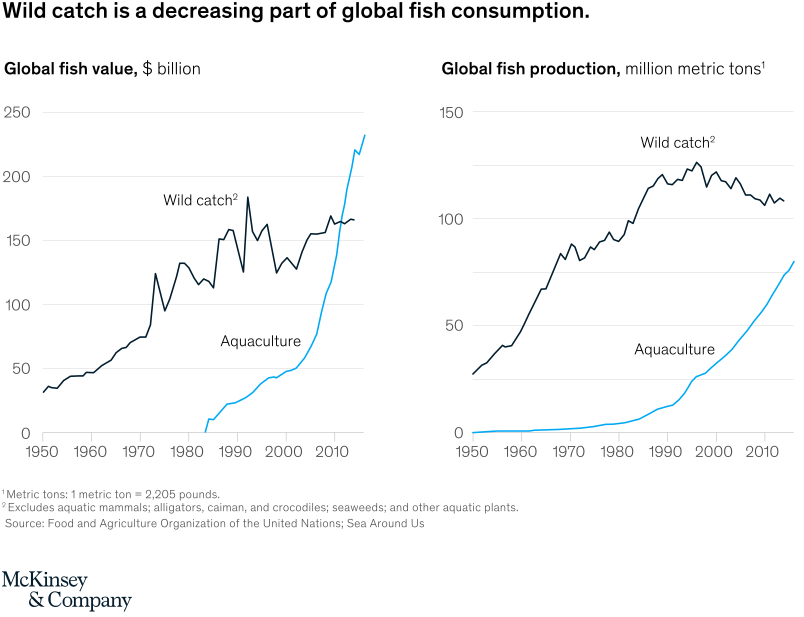
As boats across the world search for a good haul, wild-fish capture has been slowly declining. Since the mid-1990s, the amount of wild fish processed has fallen by about 0.6 percent on an annual basis, while the amount coming from aquaculture rose by 5.7 percent (Exhibit 1). (Aquaculture production comprises entities that breed, rear, and harvest all types of fish as well as other organisms that live in water.) The value of fish coming from aquaculture now tops $250 billion annually, compared with about $170 billion for wild catches.
Exhibit 1
We strive to provide individuals with disabilities equal access to our website. If you would like information about this content we will be happy to work with you. Please email us at: McKinsey_Website_Accessibility@mckinsey.com
To cope with the decreased catch in their traditional fishing grounds, commercial fishing companies have considerably expanded their footprint on the oceans. In addition to targeting new species, they have increased their fishing efforts in tropical zones and extended their operations from coastal regions to the high seas, raising the total area fished from 60 percent to 90 percent of the world’s oceans.4
Overall, the world’s fish consumption is predicted to increase by 20 percent from 2016 to 2030, driven by global population growth, the expansion of the middle class, and greater urbanization.
Thanks to technological improvements, fishing companies have also penetrated further depths to target deepwater animals such as grenadiers and blue lings. Fishing these species is rarely sustainable because many have slow reproduction rates, which limits spawning and population growth. In the past, targeting such fish has often resulted in ecological disasters. In the 1980s, for instance, the deep-sea orange roughy almost suffered extinction through overfishing until researchers discovered that it was slow growing and exceptionally late to mature.
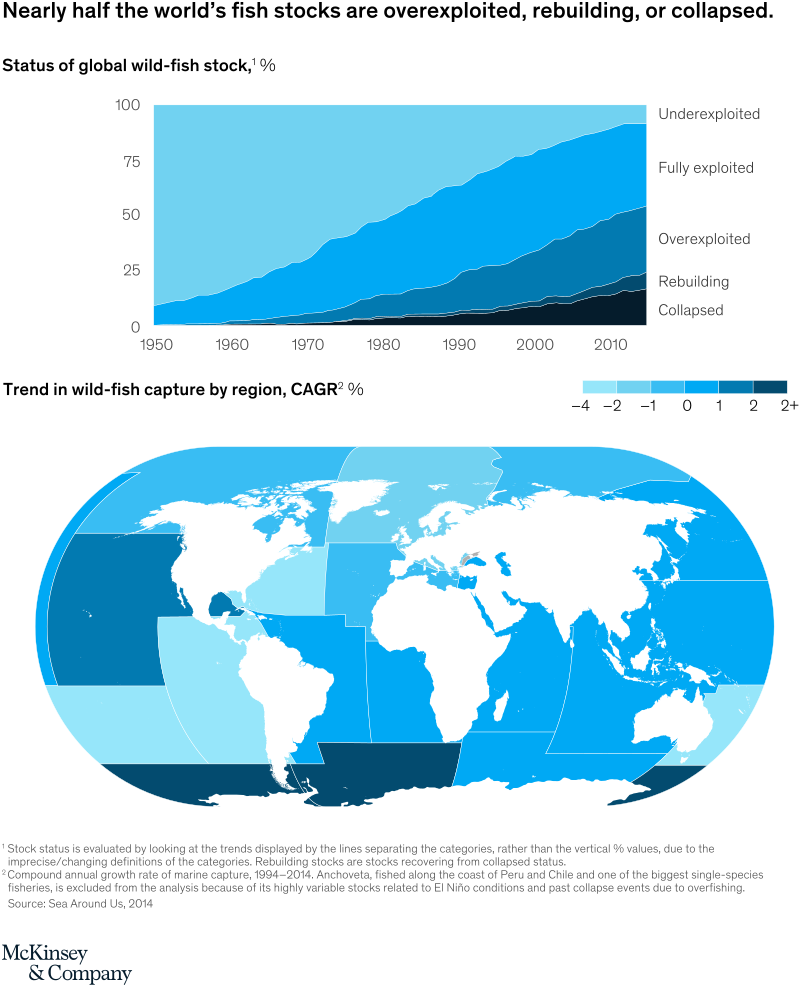
As fishing companies expand their reach, they are putting extreme pressure on the ocean environment. About half the world’s fish stocks are now classified as collapsed, rebuilding, or overexploited, and wild-catch rates are falling in most regions (Exhibit 2). This phenomenon is particularly apparent with large fish at the top of the food chain, including sharks, tuna, and billfish.5 The loss of these apex predators has cascading effects that disrupt the equilibrium of ocean ecosystems.6 Take the decline of some shark populations, which has been known to trigger sudden and undesirable population changes in species living in the same habitat. The number of shellfish or herbivores might collapse, for instance, or a large algae bloom could develop.
Exhibit 2
We strive to provide individuals with disabilities equal access to our website. If you would like information about this content we will be happy to work with you. Please email us at: McKinsey_Website_Accessibility@mckinsey.com
Other perils also loom. By 2025, oceans could contain 250 million metric tons of plastic—one per every three tons of fish—unless companies and other stakeholders institute some mitigation measures.7 The accumulation of plastic debris may reduce the fish-survival rate, lowering stocks. Climate change, and its accompanying acidification, warming, and deoxygenation processes, is already affecting the oceans and will have profound implications for marine ecosystems, including reduced biodiversity and shifts in habitat. According to some scenarios, these shifts could decrease fishing revenues by 35 percent by 2050.8
Recognizing the growing threat to fish stocks, some countries and regions have acted to improve resource management, with mixed results.9 For instance, the United States has increased the proportion of stocks fished at biologically sustainable levels from 53 percent to 74 percent from 2005 through 2016, an increase that may be partly attributed to the Magnuson-Stevens Fishery Conservation and Management Act.10 Similarly, around 69 percent of stocks managed by the Australian Fisheries Management Authority were sustainably fished in 2015. But these regional gains are negated by overfishing in other markets, illegal fishing, and excessive waste.
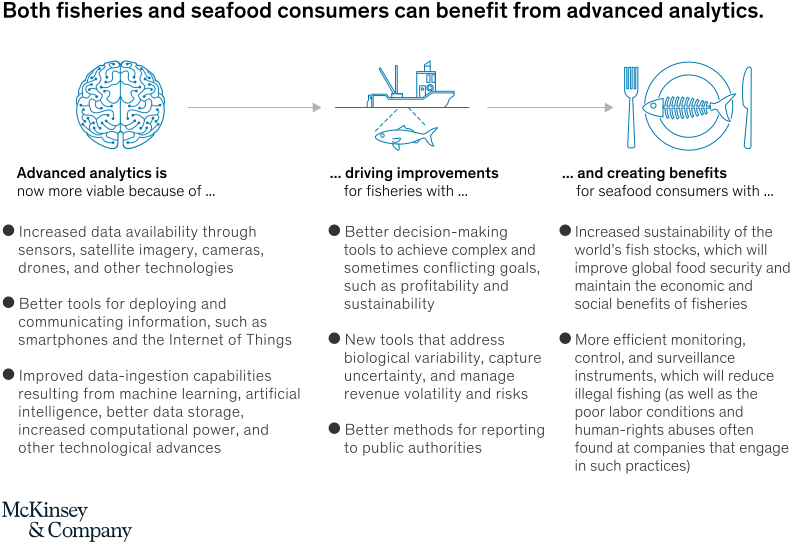
Since regulations alone cannot eliminate overfishing, fisheries need other solutions to stay on a sustainable trajectory while minimizing their environmental impact. For most issues, including catch reporting, trade-information sharing, subsidies, tariff policies, and regulation enforcement, greater national and international collaboration will help. But fisheries and the public could also benefit from the increased use of advanced analytics (Exhibit 3). These algorithms have become popular across industries over the past few years as technological improvements have increased data availability, facilitated the deployment of information, and expanded data-ingestion capabilities.
Exhibit 3
We strive to provide individuals with disabilities equal access to our website. If you would like information about this content we will be happy to work with you. Please email us at: McKinsey_Website_Accessibility@mckinsey.com
Many industry stakeholders have already incorporated advanced analytics into all components of the value chain. Here’s a look at some of the most important recent developments relevant to fisheries.
Data acquisition through sensing platforms
Sensors for collecting data have become more common, compact, and less expensive over the past few years. At the same time, the variety of platforms on which these devices can be deployed has considerably expanded, allowing them to capture data more rapidly and over greater distances. Sensing platforms that are particularly important within the fishing industry include the following:
Satellite. Optical and radar sensors on satellites can offer a holistic view of the environment at unprecedented spatial and temporal resolution, making them particularly valuable for monitoring purposes. Optical sensors measure the light reflected by the earth’s surface across a wide range of the electromagnetic spectrum. Important oceanic parameters can be derived from such data, including sea temperature and turbidity. Radar sensors emit microwave radiation and measure the portion that is scattered back to the instrument. They can provide data about ocean topography, winds, sea ice, and the movement of vessels. Unlike optical sensors, radar systems can collect information even during poor weather and lighting conditions, including times when the sky is dark or cloudy.
Drones. Equipped with cameras or other sensing devices, drones are increasingly used to explore the ocean. Some are even capable of navigating underwater. Compared with oceanographic vessels, drones are cheaper and more flexible. When sent in groups, they can also provide a more exhaustive sampling of the environment.11 Although drones cover a smaller area than satellites, they can provide more detailed images, allowing them to detect smaller objects or phenomena.
Onboard or underwater devices. Data related to fishing operations and catch are typically recorded by fishermen or observers. Common parameters include those related to vessel location, gear types, and catch, including species, volume, biophysical characteristics, and discards. Onboard sensors can automate and facilitate this laborious process while simultaneously generating more exhaustive and reliable data. The data are then integrated into platforms known as electronic monitoring systems (EMSs). Several fishing-management authorities also require large fishing vessels to be equipped with vessel-monitoring systems (VMS), a technology that the European Union established in the early 2000s to support the monitoring, control, and surveillance of fishing vessels in its waters. VMS can collect information on a vessel’s position, speed, and heading. Vessel operators can also send valuable information to authorities through their VMS, such as estimated catch and the start and end times for their fishing operations. Another onboard utility, the automatic identification system (AIS), was designed to complement radar systems and decrease the likelihood of marine collisions. Like VMS, it can be used to track the activity of fishing vessels. Other sensors, such as cameras and fuel-monitoring systems, can also be placed on board or next to underwater nets for real-time tracking.
Public organizations such as the National Oceanic and Atmospheric Administration and the Copernicus Marine Environment Monitoring Service have increased the effective usage of data obtained from satellite sensors by freely publishing them. Many start-ups and other companies also offer various products related to sensing platforms, including output from satellite sensors and data-collection systems designed for commercial fisheries.
Improved data-transmission technologies
The growth of the Internet of Things (IoT), land- and satellite-based mobile networks, and smartphones makes it much easier for fisheries to transmit data from vessels for analysis. For instance, vessels can use IoT to monitor and transmit data on fuel consumption in real time. The resulting data are then sent ashore through wireless mobile networks, including 3G and 4G, when close to shore. At further distances, vessels rely on satellite networks for transmission.
The growth of the Internet of Things (IoT), land- and satellite-based mobile networks, and smartphones makes it much easier for fisheries to transmit data from vessels for analysis.
More insightful data analysis
Computational power has increased substantially, making it easier to process and analyze information using sophisticated algorithms. Across industries, some of the most important advances relate to the rise of artificial intelligence and machine learning, which can identify hidden relationships in large amounts of data. In particular, image-recognition and object-detection tools, powered by deep learning, have made a significant leap forward during the past decade. For instance, onboard cameras, assisted by image-recognition software, can provide fishermen with important information on the content of their catch in real time, including species, volume, and fish size.
Fishing-industry stakeholders are already transforming their operational and business processes by incorporating AA into all parts of the value chain, including fishery management, detection and capture, processing, reporting, and surveillance and control (Exhibit 4). They typically use multiple AA tools and sensors in combination, and a few even apply them from end to end within the value chain (see sidebar, “How are fisheries exploring new technology? An interview with Matts Johansen, CEO of Aker BioMarine Antarctic”). We have found that in some of the most important use cases involving AA and fishing, the following actions have been taken.
Exhibit 4
We strive to provide individuals with disabilities equal access to our website. If you would like information about this content we will be happy to work with you. Please email us at: McKinsey_Website_Accessibility@mckinsey.com
Monitoring illegal, unreported, and unregulated fishing
Authorities leverage AA to combat illegal, unregulated, and unreported fishing using geolocation data from AIS and VMS. AA can predict whether fishing vessels are actively engaged in fishing by looking at their AIS speed and course profile. For example, a vessel that slows down to one to three knots and frequently changes direction would likely be fishing. If geolocation data are not available, AA can also determine the position of vessels through image-recognition algorithms and satellite imagery (both radar and optical) that allow authorities to monitor the fishing fleet directly from space and detect any suspicious activity under their purview, such as fishing in restricted zones or the offloading of fish cargo from one vessel to a refrigerated transport vessel—a practice that is sometimes used to conceal a catch from authorities.
Some industry organizations also use sensor data to monitor fishing activity, with the goal of increasing sustainability, such as Global Fishing Watch, a not-for-profit organization that aims to increase transparency by offering free data about the activity of the global fishing fleet based on AIS, VMS, and satellite imagery.12
Improving the detection of fish
Most fisheries have scarce data about their target catch. They might assess stock yearly, rather than making more frequent observations, and their analyses focus on information about landed catches and data recorded by observers. Tools that incorporate advanced analytics can provide a more dynamic, reliable, and nuanced view of the fluctuating ocean environment.
Consider patterns related to fish aggregation and migration, which change in response to temperature, wave height, the presence of sea ice, and other ocean conditions. Fisheries can monitor these changes through satellite imagery obtained from sensors. Complemented with information from other sources, such as the location of fishing vessels and catch data, advanced analytics can help determine the distribution and migratory patterns of a target species over time and space with greater accuracy and frequency.
Some researchers have already applied advanced analytics to get better information on the distribution of fish. One team developed high-resolution predictive models by combining various ocean data, including sea-surface temperature, wind speed, and chlorophyll levels associated with plankton, with information obtained from fisheries and tagging sensors. The models provide daily recommendations about where to fish and how to avoid bycatch, increasing efficiency.13 With a more detailed and dynamic vision of fish stocks, fishing companies can decrease the amount of time, effort, and fuel required for each catch. Likewise, authorities can use the data to improve resource management.
Reporting to authorities and central managers
As noted earlier, fishermen and independent observers typically monitor and report fishing activities themselves. The results are then sent to relevant authorities or central managers within their company. EMS can automate and facilitate this time-consuming process to generate more exhaustive and reliable data based on sensor input. These systems typically consist of cameras connected to a GPS receiver and other vessel-tracking devices, such as engine-monitoring sensors that send data on fuel consumption in near real time. As fishing companies evolve toward a more data-rich environment, advanced analytics will become more and more relevant. Eventually, fishing companies will be able to combine data in ways that deliver new insights about key operational-performance drivers, such as fuel consumption and fish-catching rates.
Traceability
The supply chain in the seafood industry is complex, opaque, and lacking in international harmonization because the stakeholders involved often closely guard their information. 14 The lack of clarity makes it easier for vessels to skirt regulations and fish illegally. It also frustrates consumers, who are increasingly asking for more information about the source and freshness of the food on their plates.
The supply chain in the seafood industry is complex, opaque, and lacking in international harmonization because the stakeholders involved often closely guard their information.
To improve transparency, some researchers are investigating distributed-ledger technologies that track and store information on transactions, including data on the movement of goods along the supply chain, in a secure, distributed database. Although distributed-ledger technologies are not classified as advanced-analytics tools, they are an important enabler. The information in a distributed-ledger technology database, including insights from advanced analytics, is available to all approved users in real time.
Researchers are also investigating other technologies for tracking seafood, such as radiofrequency-identification tags and quick response codes, both of which transmit product information when scanned. With tagging, fishing companies may find it easier to receive permission to place labels on their products certifying that they are approved by the Marine Stewardship Council and other organizations that guarantee a product has been sustainably sourced, monitored along the supply chain, and correctly labeled. Consumers may increasingly look for such labels, giving an advantage to those that fish responsibly.
Although commercial fishing companies are exploring advanced analytics through pilots and other activities, their decisions about where, when, and how to fish are still largely based on intuition and experience. Similarly, most regulators are not taking full advantage of advanced analytics. They have collected and analyzed some data, but their information is often incomplete and prone to inaccuracies, especially in emerging markets.
With all industry stakeholders concerned about fishing stocks, it is now time to take a more aggressive approach to advanced analytics. As noted earlier, recent technological advances will facilitate this push, since costs for data storage and processing are decreasing each year. Their greater affordability means that most fishing companies and other stakeholders can now afford to implement more advanced-analytics tools in the near future. Likewise, talent recruitment will become less difficult for fisheries since the supply of data scientists, engineers, and technicians is growing. Fisheries will still face more challenges in acquiring talent than well-known tech companies or other industries that have traditionally promoted advanced analytics, but the recruitment pool will be larger.
Fishing companies
To guide their advanced-analytics journey, fishing companies must create a road map focusing on challenges they hope to address, such as those related to fishing efficiency, capture volatility, and fleet monitoring. To identify quick wins, companies should first assess their data stores to see what information is readily available. Most will find that they already have much relevant information on hand, including vessel-specific data on daily catch (both volume and species), GPS position, and fuel consumption.
Although commercial fishing companies are exploring advanced analytics through pilots and other activities, their decisions about where, when, and how to fish are still largely based on intuition and experience.
Simple yet powerful use cases could be built around such data. Rather than using this information for purely descriptive purposes—for instance, noting the average catch for each vessel during past months—fishing companies could adopt a forward-looking analytical approach. One analysis might involve using geospatial modeling to map fishing activity and catch rate over the course of the season, allowing fisheries to track the fleet more closely and gain a better understanding of performance drivers. Increased fishing efficiency would also reduce fuel consumption and running costs. In addition to such simple analyses, fishing companies could use geospatial modeling to predict the location of targeted fish according to various environmental conditions. Such tools could inform not only fishing operations but also downstream commercial activities, including seafood pricing and labeling.
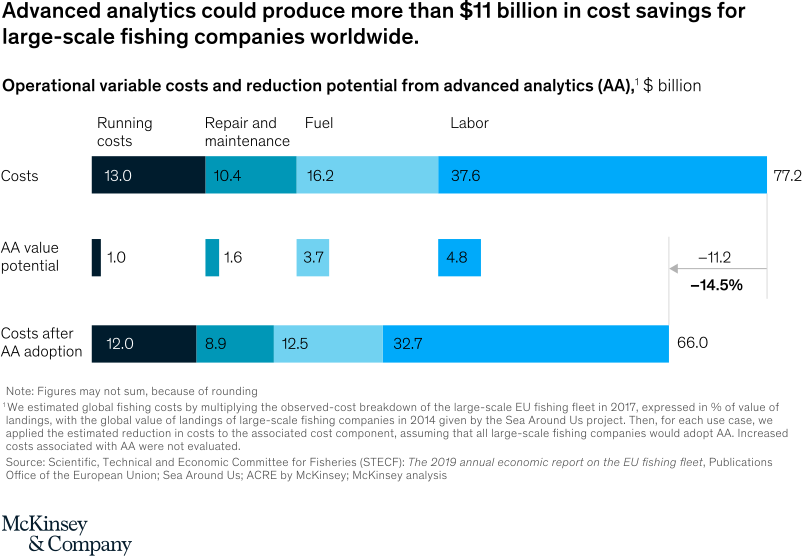
Fishing companies will also find many other use cases for advanced analytics. For example, they could generate even greater fuel savings by examining data from IoT sensors that provide information on vessel behavior, including fuel consumption and navigation conditions. Their analyses could help them generate real-time recommendations about the most energy-efficient routes and maneuvers. Similarly, fishing companies could examine data from onboard sensors to determine if any equipment is experiencing the sorts of problems that typically occur before a breakdown. With this information, they could detect potential failures ahead of time, thereby preventing costly repairs and long downtimes. In an analysis of large fishing companies worldwide, we estimated that using advanced analytics could produce more than $11 billion in savings by reducing running costs, as well as expenses for fuel, labor, and repair and maintenance (Exhibit 5).
Exhibit 5
We strive to provide individuals with disabilities equal access to our website. If you would like information about this content we will be happy to work with you. Please email us at: McKinsey_Website_Accessibility@mckinsey.com
While these potential gains are impressive, fishing companies will not achieve them by simply implementing advanced-analytics initiatives. Instead, they must undertake an end-to-end digital transformation throughout all their functions.15 Such transformations require employees to have the right skill sets, as well as appropriate tools, processes, and interfaces (for instance, dashboards where they can readily access data). In addition, organizations should provide training and support to help employees see the value of advanced analytics, especially if they appear reluctant to change their ways. Without this support, employees may view advanced analytics as an imposition—a mind-set that is likely to impede progress.
Government and fishery-management agencies
Advanced analytics can increase transparency about seafood from ocean capture to the dinner table
With fish stocks dwindling and environmental challenges mounting, governments and fishery-management agencies could consider investing in data-collection technologies and research programs that can provide a comprehensive, near real-time vision of both ocean resources and fishing activities. By leveraging the data, they can adopt new measures and regulations more quickly and also rapidly respond to external pressures such as climate change. Fishing quotas could also become more dynamic. Rather than setting a quota annually, at the beginning of the fishing season, authorities could make adjustments throughout the year based on real-time information about the amount and type of catch that vessels are collecting.
The current exchange of information between fishermen and authorities is not optimal.16 A collaborative problem-solving approach—potentially happening at the global or regional level—is needed to develop a clear road map defining data standards and mutual goals, such as those for by catch reduction. These efforts would build trust among stakeholders and benefit all.
Food companies
By improving both the monitoring of fishing activities and the reporting of associated catches, advanced analytics can increase transparency about the seafood supply chain from ocean capture to the dinner table. Food companies can share this information with consumers, who have a growing interest in the quality, traceability, and sustainability of food products. In addition to their own health, they are concerned about environmental impact. If advanced analytics reveals that most of a company’s catch comes from endangered species or overfished areas, the company can shift to other options to increase sustainability (either moving its own fishing fleets or changing suppliers). Certain technologies, including distributed-ledger technologies and radio-frequency-identification tags, can help companies share their insights about catch origin more efficiently and might merit additional investment.
Modern farmers already rely on sophisticated weather forecasts, sensors, and geospatial tools to optimize their harvest and manage land more sustainably. Now it’s time for fishing companies and other stakeholders to start their own digital and analytical journey. Getting fuller nets and larger fish is one goal, but a more important objective relates to sustainability. As fish stocks drop and fishing companies expand their reach, advanced analytics may be one of the best tools for protecting endangered species and other ocean resources. While data and algorithms may seem a better fit for boardrooms than boats, some fisheries have already achieved major gains by applying them. It’s now time for more widespread adoption before the environmental consequences of overfishing accelerate.
,
Read More » Posted in Satellite, Sensors, Water | Comments Off on Precision Fisheries: Navigating A Sea of Trouble With Advanced Analytics
Via Eurasia View, a report on a new satellite-based algorithm which can pinpoint crop water use:
The growing threat of drought and rising water demand have made accurate forecasts of crop water use critical for farmland water management and sustainability. But limitations in existing models and satellite data pose challenges for precise estimates of evapotranspiration — a combination of evaporation from soil and transpiration from plants. The process is complex and difficult to model, and existing remote-sensing data can’t provide accurate, high-resolution information on a daily basis.
A new high-resolution mapping framework called BESS-STAIR promises to do just that, around the globe. BESS-STAIR is composed of a satellite-driven biophysical model integrating plants’ water, carbon and energy cycles — the Breathing Earth System Simulator (BESS) — with a generic and fully automated fusion algorithm called STAIR (SaTellite dAta IntegRation).
The framework, developed by researchers with the U.S. Department of Energy’s Center for Advanced Bioenergy and Bioproducts Innovation (CABBI) at the University of Illinois at Urbana-Champaign, was tested in 12 sites across the U.S. Corn Belt, and its estimates have achieved the highest performance reported in any academic study so far.
The study, published in the European Geosciences Union’s Hydrology and Earth System Sciences journal, was led by CABBI’s Postdoctoral Research Associate Chongya Jiang and project lead Kaiyu Guan, Assistant Professor in the Department of Natural Resources and Environmental Sciences (NRES) and a Blue Waters Professor at the National Center for Supercomputing Applications (NCSA).
“BESS-STAIR has great potential to be a reliable tool for water resources management and precision agriculture applications for the U.S. Corn Belt and even worldwide, given the global coverage of its input data,” Jiang said.
Traditional remote-sensing methods for estimating evapotranspiration rely heavily on thermal radiation data, which measure the temperature of the plant canopy and soil as they cool through evaporation. But those methods have two drawbacks: the satellites can’t collect data on surface temperatures on cloudy days; and the temperature data aren’t very accurate, which in turn affects the accuracy of the evapotranspiration estimates, Jiang said.
The CABBI team instead focused on the plant’s carbon-water-energy cycles. Plants transpire water into the atmosphere through holes on their leaves called stomata. As the water goes out, carbon dioxide comes in, allowing the plant to conduct photosynthesis and form biomass.
The BESS-STAIR model first estimates photosynthesis, then the amount of carbon and water going in and out. Previous remote-sensing methods did not consider the carbon component as a constraint, Jiang said. “That’s the advance of this model.”
Another advantage: Surface temperature-based methods can only collect data under clear skies, so they have to interpolate evapotranspiration for cloudy days, creating gaps in the data, according to Jiang. The all-weather BESS-STAIR model uses surface reflectance, which is similar on clear and cloudy days, eliminating any gaps.
The STAIR algorithm fused data from two complementary satellite systems — Landsat and MODIS — to provide high-resolution data on a daily basis, providing both high spatial and high temporal resolution. Landsat collects detailed information about Earth’s land every eight to 16 days; MODIS provides a complete picture of the globe every day to capture more rapid land surface changes.
This isn’t the first time researchers have combined data from the two satellite sensors, but previous methods only worked in a small region over a short time period, Guan said. The previous algorithms were difficult to scale up and weren’t fully automatic, requiring significant human input, and they couldn’t be applied across broad areas over a longer time period.
By contrast, the CABBI team’s framework was evaluated in different regions across the U.S. Corn Belt over two decades, Jiang said. Researchers built a pipeline on NCSA’s supercomputer to automatically estimate surface reflectance as well as evapotranspiration on a large scale for extended time periods. Using data from 2000 to 2017, the team applied BESS-STAIR in 12 sites across the Corn Belt, comprehensively validating its evapotranspiration estimates with flux tower measurements at each site. They measured overall accuracy as well as spatial, seasonal, and interannual variations.
“We are able to provide daily, 30m-resolution evapotranspiration anytime and anywhere in the U.S. Corn Belt in hours, which is unprecedented,” Guan said.
The breakthrough will have real-time, practical benefits for U.S. farmers coping with the increasing severity of droughts, as documented in a number of recent studies.
“Precision agriculture is one of our major targets. Evapotranspiration is very important for irrigation and also very important to water management,” Guan said. “This is a solution that goes beyond experimental plots and impacts the real world, for millions of fields everywhere.”
,
Read More » Posted in Satellite, Water | Comments Off on New Satellite-Based Algorithm Pinpoints Crop Water Use
Via World Economic Forum, a look at how data and technology can help tackle the globe’s water pollution challenge:
Humans have wrestled with water quality for thousands of years, as far back as the 4th and 5th centuries BC when Hippocrates, the father of modern medicine, linked impure water to disease and invented one of the earliest water filters. Today, the challenge is sizeable, creating existential threats to biodiversity and multiple human communities, as well as threatening economic progress and sustainability of human lives.
Increasing the economic and human cost of toxic water-bodies
To set up effective interventions to clean rivers, decision-makers must be provided with reliable, representative and comprehensive data collected at high frequency in a disaggregated manner. The traditional approach to water quality monitoring is slow, tedious, expensive and prone to human error; it only allows for the testing of a limited number of samples owing to a lack of infrastructure and resources. Data is often only available in tabular formats with little or no metadata to support it. As such, data quality and integrity are low.
Using automated, geotagged, time-stamped, real-time sensors to gather data in a non-stationary manner, researchers in our team at the Tata Centre for Development at UChicago have been able to pinpoint pollution hotspots in rivers and identify the spread of pollution locally. Such high-resolution mapping of river water quality over space and time is gaining traction as a tool to support regulatory compliance decision-making, as an early warning indicator for ecological degradation, and as a reliable system to assess the efficacy of sanitation interventions. Creating data visualizations to ease understanding and making data available through an open-access digital platform has built trust among all stakeholders.
Pictorial representation of a non-stationary, real-time sensor system with cloud-based data storage and digital dissemination capabilities
How machine learning can produce insights
Beyond collecting and representing data in easy formats, there is a possibility to use machine learning models on such high-resolution data to predict water quality. There are no real-time sensors available for certain crucial parameters estimating the organic content in the water, such as biochemical oxygen demand (BOD), and it can take up to five days to get results for these in a laboratory. These parameters can potentially be predicted in real-time from others whose values are available instantaneously. Once fully developed and validated, such machine learning models could predict values for intermediary values in time and space.
Real-time application of a neural network to easily available parameters to predict other water quality indicators
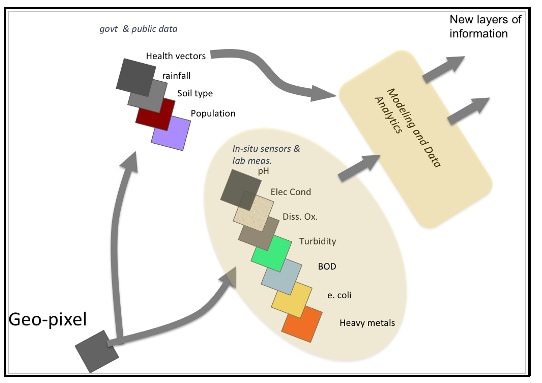
Furthermore, adding other layers of data, such as the rainfall pattern, local temperatures, industries situated nearby and agricultural land details, could enrich the statistical analysis of the dataset. The new, imaginary geopixel, as Professor Supratik Guha from the Pritzker School of Molecular Engineering calls it, has vertical layers of information for each GPS (global positioning system) location. Together they can provide a holistic picture of water quality in that location and changing trends.
The new imaginary geopixel, as Professor Supratik Guha from the Pritzker School of Molecular Engineering calls it, has vertical layers of information for each geotagged location
Technology and public policy
In broad terms, machine learning can help policy-makers with estimation and prediction problems. Traditionally, water pollution measurement has always been about estimation – through sample collection and lab tests. With our technology, we are increasing the scope and frequency of such estimation enormously – but we are also going further. With our machine learning models, we are trying to build predictive models that would completely change the scenario of water pollution data. Moreover, our expanded estimation and prediction machine learning tools will not just deliver new data and methods but may allow us to focus on new questions and policy problems. At a macro level, we aim to go beyond this project and hope to bring a culture of machine learning into Indian Public Policy.
Data disclosure and public policy
Access to information has been an important part of the environmental debate since the beginning of the climate change movement. The notion that “information increases the effectiveness of participation” has been widely accepted in economics and other social science literature. While the availability of reliable data is the most important step towards efficient regulation, making the process transparent and disclosing data to the public brings many additional advantages. Such disclosure creates competition among industries on environmental performance. It can also lead to public pressure from civil society groups, as well as the general public, investors and peer industrial plants, and nudge polluters towards better behaviour.
,
Read More » Posted in Satellite, Water | Comments Off on How Technology and Reliable Data Can Help Tackle Water Pollution
Someday we’ll have an Internet of Fish. Underwater sensors, robots and cameras will reveal sea creatures to catch and avoid, changing ocean conditions and goings-on in farmed fish pens — all at the tap of an app. Someday we won’t stare at the seafood counter wondering if a “halibut” is really a halibut and where it came from. Someday methane-eating bacteria will clean the atmosphere and produce fish feed ingredients in the process.
That day is on the horizon — and you don’t even have to squint.
The information technology and biotech revolutions were slow to reach the over $390 billion global seafood industry, but now they are surging in to join an upwelling of technological innovation within the industry, from land-based fish farming to deep-sea fishing. Seatech, with its potential to address urgent needs such as climate change adaptation, supply chain transparency and sustainable fishing and aquaculture, promises to be at least as big an opportunity as the agtech wave that preceded it.
The Internet of Fish comes together
It’s been clear for a while that an Internet of Fish could bring all kinds of benefits, including better fisheries management, more productive and lower-waste fishing and traceable fish consumers can feel good about. But only recently has connecting all the elements of seafood’s supply chain — under the water, on the water and on shore — emerged as a realistic goal. Just 10 years ago, underwater cameras were super expensive, and refining other electronics for underwater operation wasn’t a priority. Now rafts of submersible robots, cameras and sensors are sending critical data to phones and computers on boats and on land, allowing real-time decision making.
The robots patrol open-ocean fish farms (PDF), recording the health, size and feeding habits of fish within the net pens, along with environmental conditions. They can even fix frayed nets and remove waste. Cameras in net pens and onshore aquaculture tanks keep an electronic eye out for potential problems so farmers can take preventive steps, while cameras on fishing gear let fishers see what’s in the water before they drop their nets. That helps them avoid bycatch and keep fisheries open.
Tools that gather big data from wide swaths of the ocean can make targeted fishing even more effective. The National Oceanic and Atmospheric Administration’s EcoCast tool, for example, draws on-location reports and satellite measurements of ocean conditions to show West Coast fishers where they are most likely to find swordfish and least likely to snag turtles and other threatened species. The key is making the data available in real time so that fishing boats can use it on the water.
Fish farmers are also benefiting from new data-sharing tools. NOAA’s National AquaMapper collects over 100 aquaculture-relevant geospatial data types in a web-based tool for exploring, siting and permitting offshore aquaculture operations. The tool can spare farmers months of back-and-forth paperwork with multiple agencies.
Putting the ‘see’ in seafood’s supply chain
Storied seafood has been on the industry’s menu for some time. Forward thinkers realize people who care about how their coffee got to their cup also want to know how their seafood ended up on their plate. Consumer-facing companies that work directly with fishers and farmers already can tell that story, but they’re a tiny portion of the market. For the industry at large, seeing through seafood’s more typically long, murky supply chains has been a challenge.
A whole suite of traceability and transparency technologies (PDF) is poised to change that. Companies developing these tools are small-scale at this point, but the sheer number and diversity of technologies popping up shows it is possible for seafood buyers to track where a fish was caught, the dock it was hauled up on, the temperature it’s been kept at and other meaningful data. ThisFish(a former Fish 2.0 finalist), for example, traces seafood on its journey from water to table using software that lets each handler in the chain upload information on each coded fish. The system operates in Canada’s east and west coast fisheries.
Portugal-based Bitcliq (another Fish 2.0 alumnus) is using a blockchain platform to trace fish from catch to dock. It’s also connecting fishing fleets with retail buyers, enabling on-the-spot purchases. Blockchain proponents think the shared digital ledger, which shows a cryptographically protected, time-stamped history of data uploads and transactions, has the potential to transform seafood supply chains worldwide. In addition to providing traceability, blockchain technology could make seafood trade financing viable: With reliable supply chain information and a range of blockchain solutions available, financial institutions could build better predictive models and develop finance and insurance products matched to the seafood industry’s real risks and needs.
Hooking up automated data capture solutions incorporated in packaging to Internet of Fish data coming from the water will be central to advancing blockchain adoption and other traceability solutions. Data capture by sensors, robots, computer vision and IoT systems overrides the problem of human error (or intentional fraud) in supply chain reporting, and expands the types of data available. In the aquaculture industry, big companies such as Amazon and Cargill are already starting to digitalize the salmon feed supply chain to trace feed sources.
The convergence of traceability and transparency technologies will open a path to real progress on issues such as mislabeling, illegal fishing and labor violations by revealing a full picture of seafood’s fragmented supply chain. The links — small fishing boats and farms, an array of middlemen, international retailers — still will be there, but they’ll be easy to find and connect. As with the web after Google, suddenly we’ll have everything at our fingertips.
Let them eat flies — and bacterial proteins and algae
Better fisheries management and supply chain transparency can only do so much. Aquaculture could relieve the pressure on wild fish stocks while providing good, clean protein to a world increasingly hungry for it — but only if we stop feeding farmed fish with wild forage fish. Advances in biotech could provide the answer here.
Biotech startups focused on algae, bacteria-powered waste solutions and insect proteins target the fish feed market (PDF) because it’s where low-volume production of new nutrients has the highest payoff and market demand. Oil from microalgae is an excellent, scalable fish oil alternative that delivers better animal health and growth rates than vegetable feeds, as well as better tasting, more nutritious fish.
And companies that feed methane, carbon and other industrial byproducts to bacteria in fermentation tanks are pulling out high-quality proteins that rival those in the best fish meals. Black soldier flies and other fast-growing insects that eat food waste also could be an excellent protein source for fish feeds.
Collaboration, not competition, is powering seatech’s rise
Big picture: All these technologies are potentially game-changing innovations for oceans and the seafood sector. But counter to the narrative of cutthroat competition that clings to tech generally, seatech likely will succeed only through combination and collaboration. The market is huge and these are not standalone solutions — they’re specialized pieces of a vast global whole where solutions were needed yesterday.
Growing companies are changing their priorities in recognition of this fact. More than half the companies coming into the Fish 2.0 network seek partnerships alongside investment. We started Fish 2.0 as a competition, but we’ve seen that growth in the sector depends on collaboration. Seatech’s success will lie in solving this equation: the right product plus the right business model plus the right partnerships. The result will be strong returns plus deep positive impact — and that’s a someday we can truly look forward to.
,
Read More » Posted in Sensors, Water | Comments Off on The Rise of SeaTech: An Internet of Fish
New technical innovations such as location-tracking devices, GPS and satellite communications, remote sensors, laser-imaging technologies, light detection and ranging” (LIDAR) sensing, high-resolution satellite imagery, digital mapping, advanced statistical analytical software and even biotechnology and synthetic biology are revolutionizing conservation in two key ways: first, by revealing the state of our world in unprecedented detail; and, second, by making available more data to more people in more places. The mission of this blog is to track these technical innovations that may give conservation the chance – for the first time – to keep up with, and even get ahead of, the planet’s most intractable environmental challenges. It will also examine the unintended consequences and moral hazards that the use of these new tools may cause.Read More