Via Thomson Reuters Foundation, an article on how satellite alerts are helping fight deforestation in Africa:
A system using satellite data to send free alerts when trees are destroyed has been linked to a significant drop in forest losses in Africa, researchers and academics said on Monday.
Deforestation dropped by an average of 18% across nine central African countries after the alerts were introduced, found a study published in the journal Nature Climate Change.
“This is really a small revolution,” said study lead Fanny Moffette, a postdoctoral researcher at the University of Wisconsin-Madison.
“Now that we know subscribers of alerts can have an effect on deforestation, there’s potential ways in which our work can improve the training they receive and support their efforts,” she added in a statement.
Trees absorb about a third of greenhouse gas emissions produced worldwide, but tropical rainforests disappeared at a rate of one football pitch every six seconds in 2019, according to data published by Global Forest Watch.
The study looked at whether the alert system – launched by the Global Forest Watch monitoring project in 2016 – was affecting tree losses in 22 tropical countries in South America, Africa and Asia.
It draws on satellite images updated every eight days, and uses artificial intelligence to identify where trees are vanishing by comparing pictures. It then warns subscribers covering the area so they can investigate and take action.
Organisations signed up to the alerts include governments, wildlife officials and park authorities, as well as NGOs and local forest protectors.
They have used the data to stage extra patrols in areas shown as losing trees and to catch illegal loggers in the act, said Katherine Shea at Global Forest Watch.
Overall the risk of deforestation was 18% lower in 2016-2018 than in earlier years in the nine African countries, which included Cameroon, the Central African Republic and the Democratic Republic of Congo.
However, deforestation did not decrease overall in South American or Asian countries covered by the alerts.
The authors said similar technology already available in those areas may have lessened the impact.
They estimated the alert system is likely to have stopped between $149 million and $696 million worth of damage and economic consequences from climate change.
“These new systems are making it really easy for people to have a look and see what is going on – and then take action,” said Simon Lewis, Professor of Global Change Science at University College London, who was not involved in the study.
“Having a free alert system to give people near real-time information is incredibly helpful.”
Courtesy of Outside, an interesting article on how – over the past two decades – eBird has become the go-to online platform for scientists and hobbyists alike to upload and share bird observations:
In July 1992, two Danish birders visiting Patagonia, Arizona reported the first-ever, mega-rare cinnamon hummingbird in the United States. Back then, reporting rare birds required phoning in observations to a “rare bird phone tree,” usually via the nearest pay phone—and hoping that word got out. Sometimes it did, sometimes it didn’t. In this case, a couple of other out-of-towners—a birder from Mississippi and another from Nebraska—saw the species. The Nebraskan photographed the hummingbird, flew home, developed the slide film, and snail-mailed photos to the Arizona committee in charge of validating unusual sightings. Only then did word spread, but it was too late: the hummingbird was gone, and Arizona birders missed it.
This kind of tragedy would never befall Arizona birders today. Now, within minutes of seeing a rarity, birders can text friends, alert listservs, post sightings to Facebook rare-birds groups, and—the choice of many—submit observations to eBird, a global online database.
At its most basic level, eBird documents bird sightings. A team at the Cornell Lab of Ornithology created the platform in 2002, and it became widely used by birders within a few years. As of 2020, it has collected more than 860 million global bird observations from over 597,000 registered eBirders. By sheer numbers alone, eBird is one of the world’s largest citizen-science projects. It is now used to understand species distributions, population trends, migration pathways, and even habitat use.
“If used properly, it should be a tool to understand bird populations at scale in ways we never have before, and to apply that to conservation actions,” Marshall Iliff, an eBird project leader, told me. Scientists use eBird’s open-access data to study evolution and movement of invasive species and to highlight the importance of public lands in conservation. The eBird team has also created conservation-oriented status and trend maps for hundreds of species, and eBird data are used to create live bird-migration forecasts.
At least 120 million observations are submitted per year, many through the handy eBird app, a kind of Strava-Yelp-Pokémon Go hybrid for birders. The app doesn’t ID birds for you—Cornell offers another app called Merlin for that—but instead provides an easy way to record and upload the birds you spot. To log sightings, you start a checklist (similar to the way you’d start a run on a smartwatch) and the app automatically pulls your location via GPS. You can choose hot spots near you, which generate lists of species you’re likely to see created from data submitted by users in those areas. The app tracks time and distance traveled while you “tick” species and numbers of birds seen and heard. It even lets you keep an offline checklist, so you aren’t inconvenienced without cell service. On the web platform, users can upload photos and audio recordings to beef up checklist documentation. Once submitted, the observations join thousands of others being made on the platform at any given time.
The scope and accessibility of eBird make it a resource for birders and scientists alike. The majority of eBirders use the platform as a handy bird-logging tool. I study birds for my Ph.D. at the University of New Mexico, and I also watch them recreationally. I use eBird almost daily for everything from tracking how far I walk while scanning treetops, to planning vacation birding spots, to scouting remote Andean field sites for my doctoral work. Anyone can review lists of species in hot spots like the Ramble in Central Park stretching back decades, study maps of where birds are seen, analyze how frequently certain birds appear at different times of the year, and peruse photos and audio recordings from all over the globe.
Undeniably, eBird has changed birding culture, a quirky world already full of strong opinions. It brings birders together and allows for rapid information sharing. It’s also created new—and sometimes contentious—etiquette and social dynamics.
The closest thing to an official guide for birding etiquette is the American Birding Association’s Code of Birding Ethics, which emphasizes a few basic tenets that can be summarized as: Respect fellow birders, their diverse interests, and skill levels. Welcome and encourage beginners. Respect birds and other wildlife. Don’t trespass on private or restricted property. Be mindful of space and privacy when birding in groups. (Since the pandemic, a new set of guidelines on birding and social distancing has been added to the code, titled “Keep your eyes on the sky and your butt close to home!”)
Birders are typically friendly, both in person and online, with email exchanges often ending in well-wishes of “Good birding!” But a code of ethics is necessary because, as with any activity that can become competitive, birding has a dark side. Rivalry, animosity, and ego have long been hallmarks of the bird world. Even the famous naturalist John James Audubon plagiarized and invented species to convince members of the English nobility to promote his work. Birders sometimes go to semi-desperate lengths to track down birds, and online platforms like eBird that rank birders and sightings, akin to athletes on leaderboards, can amplify competition.
Although eBird is primarily an observation tool and a scientific database, the site still allows users to size each other up: anyone can view rankings of the top eBirders in different hot spots, counties, states, and entire countries. You can even peruse a list of the top 100 eBirders in the world. These types of competitive lists have birthed trends like endless Big Years, in which birders constantly compete to see who can spot the most species in a year. In turn, such fads have spurred counterinitiatives, like the five-mile-radius challenge, which encourages birders to enjoy birds in local areas rather than seeking them out in far-flung places. Local birding has soared during the COVID-19 pandemic, as many work from home and explore their own backyards.
Screenshots from the author’s eBird app showing checklists and hot spots in her home state of New Mexico (Photo: eBird)
If an eBird user makes their profile public, other eBirders can view their recently submitted checklists and photos. Essentially, this means that birders can keep tabs on one another. Last October, when a friend was in Belize, I lived vicariously through his trip by peeking at his eBird checklists each day, and they brightened my mood amid dropping fall temperatures in New Mexico. I’ve also received unexpected text or Facebook messages from birders with quips like, “Looks like you had an awesome day!” after they saw checklists I submitted. These interactions shouldn’t be surprising, given the public nature of eBird data, but it occasionally strikes me as odd that people I don’t know well can see exactly where I walked for eight hours and exactly how many Wilson’s warblers I counted while I did so.
The eBird database also maintains a frequently updated alerts bulletin called the Rare Bird Alert. The RBA, as many lovingly call it, pushes notifications to users so they can quickly find out who’s seeing what and where. The excitement of rare, sought-after species fuels cultures of chasing and listing that emphasize the prestige of finding rare birds and seeing more species than others.
Chasing rarities is certainly exciting—like an ephemeral, high-stakes treasure hunt where the pot of gold has wings—but the hobby can also turn into an obsession. I’ve heard stories of constant “twitching,” or compulsive bird chasing, nearly ending serious romantic relationships. For some, a reputation for finding rare birds becomes a noteworthy part of their identity. Last fall I met a birder at a popular migrant trap, a small patch of trees with a trickle of water, on the windswept plains of eastern New Mexico. He introduced himself to me by name, followed by, “You might recognize me from the Rare Bird Alert.”
A thirst for finding rarities can also encourage behavior that goes against common courtesy. One eBird app reviewer, “Notta Realname,” noted that after spotting an unusual bird for their locality, birders rang their doorbell, asking to sit in their backyard so they could see the bird. Notta Realname reported being “flummoxed” but welcomed the birders into their backyard anyway and then became frustrated when the unexpected guests displayed “questionable” ethics. Notta Realname turned away subsequent birders and then changed their privacy settings. All birders I know would agree: showing up at a stranger’s doorstep unannounced is bad form.
Because eBird is not a social-media site—there is no way to follow friends or comment on sightings—these types of interactions filter onto other platforms. Last fall an 11-year-old friend and beginning birder ticked the wrong species of quail on her checklist, which made it look like a bird from Africa and the Arabian Peninsula had been sighted in central New Mexico. Rather than wait for eBirders to flag the mistake respectfully, someone made fun of her in a Facebook birding group.
Occasionally, eBird itself is the site of bad behavior. Recently, a respected birder misidentified a common lazuli bunting for a more unusual species: a dickcissel, or “DICK” in four-letter shorthand speak, a sparrowlike bird of open grasslands easily recognized by its “flatulent buzz” calls. Several experienced birders tried correcting his mistake, but he stubbornly refused to change his ID, insisting the bird was simply “odd-looking.”
As with any activity that can become competitive, birding has a dark side.
I had my own run-in with bad behavior on eBird last November. I’d gotten wind via the eBird Rare Bird Alert that a vagrant woodcock had been spotted along the Rio Grande near Albuquerque, New Mexico, just 15 minutes from my house. American woodcocks are iconic little solitary shorebirds that live in forests and constantly bob while they walk, and they’re rarely seen out west. Naturally, I had to chase this bird. At 7 A.M. on a Sunday, I found myself walking along the river, kicking up piles of dead leaves in an attempt to flush the woodcock.
After a few hours, I’d had no luck. As I headed back to my car, I passed a group of birders also searching for the woodcock. We chatted for a bit before a well-known birder—the one who misidentified the DICK—recognized me. With a facetious smile, he asked, “How’s your goose ID going?”
The other birders stared blankly while I brimmed with silent shock and anger. He was publicly mocking me—a week before, he’d emailed me about a misidentified Ross’s goose I posted on eBird. Embarrassed, I quickly updated my observation. Our interaction should have ended there, but instead he was now calling me out for my mistake—gleefully—in front of others.
“Fine,” I said curtly, before walking back to my car.
When I got home, I ranted to my significant other, who is used to hearing too much about birds. He thought I sounded more wound up than usual—eBird can sometimes do that to you.
In recent years, eBird has grown tremendously. Between 2019 and 2020 alone, observations submitted to the database increased by 24 percent. Some believe that the rise in new eBird users is associated with a dangerous level of data imprecision. Can the data be trustworthy if they come from millions of observers who might not be able to correctly identify common backyard birds? As one well-known California birder has been known to say, “The average birder is below average.”
This is where data-vetting steps, like eBird’s review process, come in. Each eBird reviewer is a volunteer selected for their knowledge or experience in a state, region, or country. Reviewers act as quality filters and check observations for accuracy, detail, and validity. They may contact observers to request specific details about unusual sightings, point out misidentifications, or ask for justification about higher-than-expected numbers reported for a particular species. Some reviewers even go out of their way to coach users unfamiliar with eBird on how to use the database and app to enhance the quality of the information. This verification effort, in turn, makes eBird data more valuable to birders, citizen scientists, and professional scientists.
“My goal when reviewing is to make sure that an observation is documented well enough so that, in 100 years, someone who doesn’t know who the observer is can say, ‘This is reasonable,’” says Lauren Harter, an eBird reviewer of more than nine years for the Colorado River area.
Given their status, reviewers are privy to moments of birding vulnerability, such as when birders make identification mistakes. Errors are expected—even the world’s best can confuse extremely similar-looking immature gulls or drab flycatchers. If an eBird reviewer catches an ID mistake, usually from a photo, they reach out to the eBird user, typically with a polite template email that starts with, “Thank you for being a part of eBird. To help make sure that eBird can be used for scientific research and conservation, volunteers like me follow up on unusual sightings as a part of the eBird data quality process.” They’ll then explain why the species is listed incorrectly and request that the user change the ID to the correct species.
Given their status, reviewers are privy to moments of birding vulnerability.
This mutual respect between reviewers and birders tracks with offline birding etiquette, but sometimes interactions can turn to rudeness. The birder who made fun of me for my goose mistake, for example, was a New Mexico eBird reviewer, and one birder friend, after hearing the story, called the reviewer’s comment to me “way out of line.”
The relationship between reviewers and observers can be tricky to navigate. Reviewers sometimes screen as many as several hundred sightings per month, and they certainly deal with their fair share of user mistakes. I became increasingly respectful of the work they do as I spoke to more reviewers for this story. But some believe that reviewers exercise their power unfairly—for example, by accepting rare sightings by birders with good reputations, even with scarce documentation—and impose personal rules about how birding should be done in “their” territory.
Last year a friend birded at a popular eBird hot spot outside Raleigh, North Carolina, during a work trip. After submitting his checklist, he was contacted by a local reviewer who, in typical birder fashion, sent him overly detailed instructions about how to walk around the lake. My friend, a birder of 34 years, felt like his freedom to explore had been violated. There was a right and wrong way to walk around a lake now? “I was bemused that someone would want to exert control over how others experience a place,” he told me. “The idea that a hot spot has to be birded in a certain way and recorded in a certain way really takes the enjoyment out of visiting new places.”
Despite the fact that eBird has become an almost unstoppable force, some birders have resisted the eBird tide. They see the platform—and the “Cornell mafia,” as one birder put it—as supplanting traditional methods of birding that many still prefer. Observers who don’t use eBird still rely heavily on listservs or Facebook birding groups, but this can limit access to information.
“It makes you almost have to be an eBirder to keep track of this stuff anymore,” says Gary Rosenberg, a professional bird-watching guide of more than 35 years. “I call it eBorg,” he says, referencing the Star Trek character who transforms people into drones through assimilation. “If you’re not on eBird, you’re currently just sort of left out in the cold.”
On the flip side, eBird has encouraged people who may not have birded previously to contribute sightings in a popular forum. This citizen-science participation aspect of the platform, coupled with movements like #BlackBirdersWeek, are important for creating a diverse and equitable outdoors community. Increased representation and environmental awareness are sorely needed, given the estimated 2.9 billion birds lost since 1970. “Anything we can do to supercharge an interest in nature is a worthwhile goal unto itself,” says eBird’s Iliff. “I don’t think we’re going to have people who are willing to vote for climate change or preservation of public lands or endangered species, or really care about the world around us, without a level of public engagement.”
For all its unexpected dynamics, eBird has succeeded in connecting birders and scientists in ways that weren’t possible before. Last fall, while browsing through images of the species I study for my Ph.D., the giant hummingbird, I came across a photo of a bird that appeared to be wearing one of the tracking devices I use to research their migration. The eBirder who posted the photo listed his email address publicly, so I reached out to see if he had others. He was friendly, and he happily sent more my way. I flipped through them that night, amazed that a stranger’s photos might have unintended value for my research, and I wondered what other gems remained to be discovered on eBird.
Via The Conversation, a report on how satellite data provides fresh insights into the amount of water in the Nile basin:
Flowing through 11 African countries, the Nile River plays an important role in the lives of more than 24% of Africa’s population. To both upstream and downstream countries, the Nile waters are crucial in development planning, food and energy production.
As countries vie for these resources, there has been immense tension. Most notably, Egypt and Sudan have challenged Ethiopia’s decision to construct and fill the Grand Ethiopian Renaissance Dam. This is a huge project on one of the Nile’s main tributaries, the Blue Nile, which supplies more than 80% of the water reaching Egypt.
Treaties are needed to govern the allocation of water resources in the region. For this to happen it is critical to have accurate data on how much water there is. But global water scarcity data are based on insufficient ground observations. They are grossly outdated and don’t cover enough of the major transboundary river basins. This is due to funding, maintenance cost, terrain and topography. In the Nile basin, hydrological monitoring stations have significantly declined in number over the last 30 years.
But this is changing. Recent advances in hydrological satellite observations are enabling the frequent collection of much more reliable information. This has opened the door to new research efforts to update global water availability.
Hydrological satellite observations happen when a satellite – hundreds of miles away from the Earth’s surface – observes and makes recurring visits to the same site several times a month. One of these – which allows for improved assessment of the total changes in water volume – is NASA’s joint satellite mission Gravity Recovery and Climate Experiment.
Our research team is among the first to use data from this satellite mission for a water scarcity assessment in Africa. We have used the data in several studies of the Nile basin. This includes assessments into how water levels in the Nile Basin are affected by the climate and people.
The data has enabled us to make accurate calculations that weren’t possible before. For example, we have been able to assess how much surface water there is and what the soil moisture and levels of groundwater are. Previous studies focused primarily on one or some of those variables, such as the water from the river flow.
Our study shows that there’s a looming water crisis in the Nile basin. This calls for an urgent regional basin initiative on sustainable water resources management.
We used these observations to determine the total available water storage in the Nile basin between 2002 and 2020. Overall, the data revealed that the total available water storage in the basin, from all sources, could reach an average of 180 billion cubic metres per year. This estimate is about twice the current estimated storage of 88 billion cubic metres per year. Having data like this would inform how much water is allocated in the basin’s water sharing agreements.
We also used the satellite data to estimate the total available water storage for two main water tower regions (the source of the river) – Lake Victoria and the Blue Nile basin – and two major water sink regions (where slow flowing water is lost to evaporation) – the Sudd wetlands in South Sudan and the Main Nile area across Egypt.
From what was previously reported, recent Gravity Recovery and Climate Experiment satellite observations showed that the Lake Victoria water tower receives about twice the water volume that the Blue Nile basin receives during the wet season. And the Sudd basin (the southern water sink) loses about twice the water compared to the northern Main Nile region.
These updated figures call for progressive water resources planning to save additional water resources for future development in the region.
The satellite observations also confirmed that between 2002 and 2020, the Nile river basin experienced wetter conditions. In 2020, the Nile river basin had approximately eight times more water storage than it did in 2002. These wetter conditions require further planning for more water volumes during flooding seasons.
Despite this, our conclusion confirms previous assessments that the basin is water-stressed.
Water stressed
A region is said to experience water-stress if the available water to use per person per year – for indoor, agricultural and industrial needs – is less than 1000 cubic metres a year, approximately 1,000,000 litres per person per year.
For daily basic needs, a person uses approximately 150 litres a day. In Egypt (a major receiver of the Nile’s water), a person uses about 200 litres on average for domestic water needs per day. However, agriculture needs – such as food production – require between 2,000 and 5,000 litres of water per day.
If the available water to use becomes less than 500 cubic metres a year – about 500,000 litres of waters per person per year – to meet all water demands, a region is under absolute water scarcity conditions.
Because of the current and booming population projections – the basin’s population is projected to reach 800 million by 2050 – the basin is under severe water stress conditions.
To estimate the yearly available water per capita we need to divide the total available water in the region – which we found to be 180 billion cubic metres per year – by total population. We therefore estimated that the available water to use per capita is approximately 450 cubic metres a year, or approximately 1,230 litres per person a day. But there is an important caveat; the total amount of available water cannot all be extracted and used due to technological and economic constraints. Therefore, the true amount of usable water is likely considerably less than 1,230 litres per person per day.
More than ever before, riparian nations need to reinforce agreements on future water planning and new water sharing policies.
Data to the rescue
It won’t be easy to get the 11 countries in the basin to agree to a water sharing plan to avoid chronic water shortages in the future. But key to ensuring cooperation is good information sharing and technical cooperation between the riparian states.
Having accurate information on the available water will improve the understanding of common water resources and promote confidence between the basin states.
,
Read More » Posted in Satellite, Water | Comments Off on Satellite Data Provides Fresh Insights Into Amount of Water In Nile Basin
Via Terra Daily, an interesting look at how satellite data is transforming water management:
Building upon more than two decades of research, a new web-based platform called OpenET will soon be putting NASA data in the hands of farmers, water managers and conservation groups to accelerate improvements and innovations in water management. OpenET uses publicly available data and open source models to provide satellite-based information on evapotranspiration (the “ET” in OpenET) in areas as small as a quarter of an acre and at daily, monthly and yearly intervals.
Evapotranspiration is the process by which water is transferred from the land to the atmosphere, by water leaving the soil (evaporation) and water lost through plant leaves and stems (transpiration). Evapotranspiration is an important measure of how much water is used or “consumed” by agricultural crops and other plants.
In the arid western United States, where the majority of water used by people is for irrigation to grow crops, having an accurate measure of evapotranspiration is critical to balancing water supplies and water demand. Until OpenET, there has not been an operational system for measuring and distributing evapotranspiration data at the scale of individual fields across the western United States. OpenET will be available to the public next year, supplying evapotranspiration data across 17 western states.
“What OpenET offers is a way for people to better understand their water usage and, more importantly, their water loss through evapotranspiration,” said Denise Moyle, an alfalfa farmer in Diamond Valley, Nevada, and an OpenET collaborator. “Giving farmers and other water managers better information is the greatest value of OpenET.”
The OpenET platform is being developed through a unique collaboration of scientists, farmers and water managers from across the western United States, as well as software engineers specializing in data access and visualization for large Earth observation datasets.
Led by NASA, the nonprofit Environmental Defense Fund (EDF), the Desert Research Institute (DRI) and data applications developer HabitatSeven, with funding from the Water Funder Initiative and in-kind support from Google Earth Engine, OpenET primarily uses satellite datasets from the Landsat program, which is a partnership between NASA and the U.S. Geological Survey (USGS). Additional data comes from NASA’s Terra and Aqua satellites, the National Oceanic and Atmospheric Administration (NOAA) GOES series of satellites and others.
“OpenET will empower farmers and water managers across the West to build more accurate water budgets and identify stress, resulting in a more resilient system for agriculture, people and ecosystems,” said Maurice Hall, head of EDF’s Western Water program. “We envision OpenET leveling the playing field by providing the same trusted data to all types of users, from the small farmer to regional water planners.”
California’s Delta Watermaster Michael George is responsible for administering water rights within the Sacramento-San Joaquin River Delta, which supplies drinking water to more than 25 million Californians and helps irrigate 3 million acres of farmland. For him, the development of OpenET signals an exciting opportunity for the future of water in the West.
“OpenET represents a game-changing leap forward for water management,” George said. “It will help landowners and water managers in the Bay-Delta save millions of dollars that would otherwise have to be spent on water meters to more accurately measure water use, as required by state law.”
In addition to helping Delta farmers save costs, OpenET data will improve water management in the area, according to Forrest Melton, program scientist for NASA’s Western Water Applications Office. He is also with the NASA Ames Research Center Cooperative for Research in Earth Science and Technology (ARC-CREST).
“The importance of careful, data-driven water management in the Delta and other regions can’t be overstated,” he explained. “In addition to supplying water for drinking and growing food, the Delta provides critical habitat for endangered species. For a water manager, trying to balance all of these demands is almost impossible without accurate, timely data.”
The OpenET team is currently collaborating with water users on several case studies across the West. In California’s Central Valley, the Rosedale-Rio Bravo Water Storage District is already starting to use OpenET data as the foundation for an online water accounting and trading platform to help farmers in the district manage groundwater sustainably. In Colorado, high-altitude ranchers will be using OpenET as they experiment with different irrigation strategies to conserve water.
Landsat science team member Justin Huntington of DRI emphasized the value of getting this type of early feedback on the OpenET system from future users. “Working closely with farmers and water managers on the design of OpenET has given us invaluable insights into how to best make ET data available to support water management in Diamond Valley and other basins across the West,” he said.
Because the OpenET system uses open source software and open data sources, it will help water managers establish an agreed upon measure of evapotranspiration across agricultural areas, said Melton. Different estimates of evapotranspiration have previously been a source of confusion for water managers, he said, explaining that water users and managers currently have to evaluate a variety of methodologies to measure water use and evapotranspiration, which often leads to different numbers and debates over accuracy.
OpenET provides a solution to those debates, said project manager Robyn Grimm. “OpenET brings together several well-established methods for calculating evapotranspiration from satellite data onto a single platform so that everyone who makes decisions about water can work from the same playbook, using the same consistent, trusted data,” said Grimm, who is also a senior manager at EDF.
The need for a resource like OpenET is also pressing beyond California and across the American West, Melton said.
“Our water supplies in the West are crucial to providing food for the country and beyond, and yet these supplies are under increasing levels of stress,” Melton said. “OpenET will provide the data we need to address the challenge of water scarcity facing many agricultural regions around the world and ensure we have enough water for generations to come.”
,
Read More » Posted in Satellite, Water | Comments Off on Transforming Water Management In The US West With NASA Data
Via McKinsey, a look at how advanced analytics may help struggling fisheries thrive while simultaneously protecting endangered ocean resources:
At restaurants and dinner tables around the world, seafood is often the entrée of choice. Fish, crustacean, and mollusk consumption account for about 17 percent of the world’s total animal protein intake, with much of this coming from the ocean. Fish and shellfish are especially important in low-income areas where total protein intake is low and diets are less diversified.
Fishing companies—businesses that catch fish or other seafood in the wild—will play a major role in sustaining food security and supporting fishing communities. But in their quest to capture enough fish to satisfy soaring demand, they are exerting unprecedented pressure on marine and freshwater ecosystems. It now takes five times the effort (in kilowatt-hours) to catch the same amount of fish as it did in 1950, because the targeted species are now in scarce supply.1 This shortage not only jeopardizes commercial prospects for fishing companies but also greatly threatens the ability of endangered ocean species to reproduce and maintain their numbers.
Balancing fishery interests with environmental concerns is not easy, but advanced analytics (AA)—the use of sophisticated methods to collect, process, and interpret big data—might represent an untapped solution to this problem. While fishing companies, regulators, and environmentalists now apply these tools, their use is typically limited to small-scale pilots. But we may have reached the point where advanced analytics will take off within the fishing sector. In addition to the development of new technologies that support analytics in this field, both policy makers and fishing-company leaders have an increased sense of urgency because of dwindling fish stocks. Further, people entering the fishing industry or participating in regulatory development are more tech savvy than their predecessors, giving them a greater understanding of advanced analytics and other digital tools. Even fishermen from emerging markets can access information on these technologies—and their benefits—through a simple smartphone search.
The growth of advanced analytics could promote the development of precision fishing—the use of advanced tools and technologies to optimize fishing operations and management. If large-scale fishing companies around the world move to this model, they could decrease their annual operating costs by about $11 billion, and customers would benefit from lower prices for fish and seafood. Precision-fishing techniques can also contribute to improved management of ocean resources, which could increase industry profits by as much as $53 billion by 2050 while simultaneously raising the total fish biomass to at least twice the current level.2
This article attempts to paint a picture of the current situation in the fishing industry, focusing on the challenges that are making it more urgent to adapt advanced analytics and associated tools. It also discusses several of the most popular use cases that have emerged for advanced analytics, as well as others that show great potential. Finally, the article provides a practical guide to next steps for all industry stakeholders.
The appetite for tuna, salmon, shrimp, and other ocean creatures is nothing new. Demand has increased an average of 3.2 percent annually between 1961 and 2016—more than twice the 1.6 percent rate of population growth over the same period and higher than the 2.8 percent rise in consumption of terrestrial mammals.3 Overall, the world’s fish consumption is predicted to increase by 20 percent from 2016 to 2030, driven by global population growth, the expansion of the middle class, and greater urbanization (giving more people more access to seafood, as well as the electricity and refrigeration needed to store it). Consumers also increasingly prefer healthy food choices, and many view fish as a good alternative to red meat.
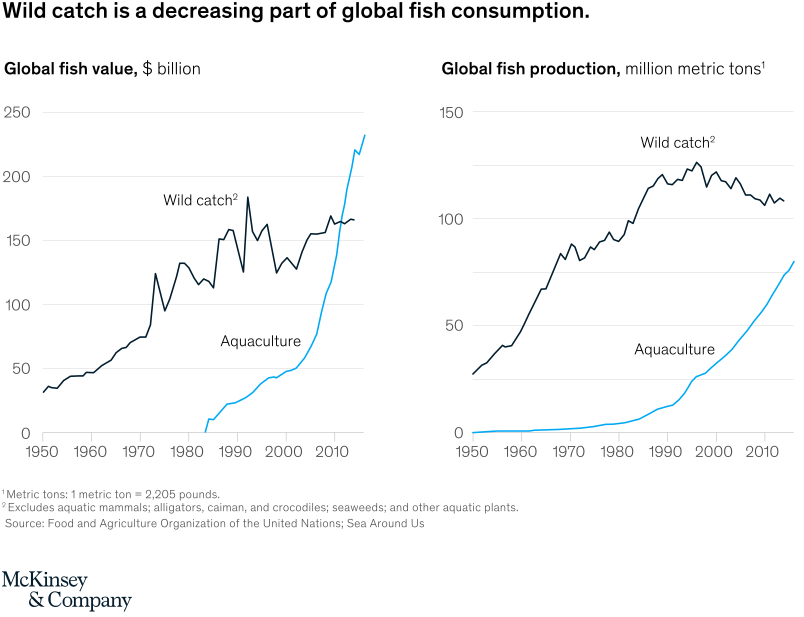
As boats across the world search for a good haul, wild-fish capture has been slowly declining. Since the mid-1990s, the amount of wild fish processed has fallen by about 0.6 percent on an annual basis, while the amount coming from aquaculture rose by 5.7 percent (Exhibit 1). (Aquaculture production comprises entities that breed, rear, and harvest all types of fish as well as other organisms that live in water.) The value of fish coming from aquaculture now tops $250 billion annually, compared with about $170 billion for wild catches.
Exhibit 1
We strive to provide individuals with disabilities equal access to our website. If you would like information about this content we will be happy to work with you. Please email us at: McKinsey_Website_Accessibility@mckinsey.com
To cope with the decreased catch in their traditional fishing grounds, commercial fishing companies have considerably expanded their footprint on the oceans. In addition to targeting new species, they have increased their fishing efforts in tropical zones and extended their operations from coastal regions to the high seas, raising the total area fished from 60 percent to 90 percent of the world’s oceans.4
Overall, the world’s fish consumption is predicted to increase by 20 percent from 2016 to 2030, driven by global population growth, the expansion of the middle class, and greater urbanization.
Thanks to technological improvements, fishing companies have also penetrated further depths to target deepwater animals such as grenadiers and blue lings. Fishing these species is rarely sustainable because many have slow reproduction rates, which limits spawning and population growth. In the past, targeting such fish has often resulted in ecological disasters. In the 1980s, for instance, the deep-sea orange roughy almost suffered extinction through overfishing until researchers discovered that it was slow growing and exceptionally late to mature.
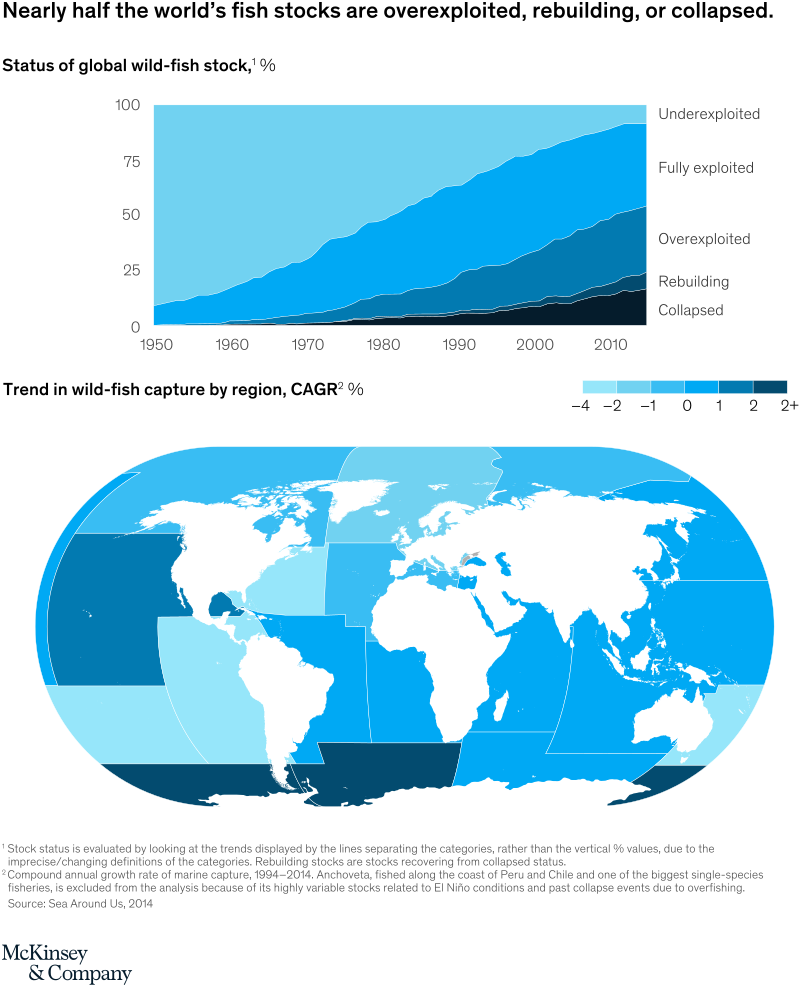
As fishing companies expand their reach, they are putting extreme pressure on the ocean environment. About half the world’s fish stocks are now classified as collapsed, rebuilding, or overexploited, and wild-catch rates are falling in most regions (Exhibit 2). This phenomenon is particularly apparent with large fish at the top of the food chain, including sharks, tuna, and billfish.5 The loss of these apex predators has cascading effects that disrupt the equilibrium of ocean ecosystems.6 Take the decline of some shark populations, which has been known to trigger sudden and undesirable population changes in species living in the same habitat. The number of shellfish or herbivores might collapse, for instance, or a large algae bloom could develop.
Exhibit 2
We strive to provide individuals with disabilities equal access to our website. If you would like information about this content we will be happy to work with you. Please email us at: McKinsey_Website_Accessibility@mckinsey.com
Other perils also loom. By 2025, oceans could contain 250 million metric tons of plastic—one per every three tons of fish—unless companies and other stakeholders institute some mitigation measures.7 The accumulation of plastic debris may reduce the fish-survival rate, lowering stocks. Climate change, and its accompanying acidification, warming, and deoxygenation processes, is already affecting the oceans and will have profound implications for marine ecosystems, including reduced biodiversity and shifts in habitat. According to some scenarios, these shifts could decrease fishing revenues by 35 percent by 2050.8
Recognizing the growing threat to fish stocks, some countries and regions have acted to improve resource management, with mixed results.9 For instance, the United States has increased the proportion of stocks fished at biologically sustainable levels from 53 percent to 74 percent from 2005 through 2016, an increase that may be partly attributed to the Magnuson-Stevens Fishery Conservation and Management Act.10 Similarly, around 69 percent of stocks managed by the Australian Fisheries Management Authority were sustainably fished in 2015. But these regional gains are negated by overfishing in other markets, illegal fishing, and excessive waste.
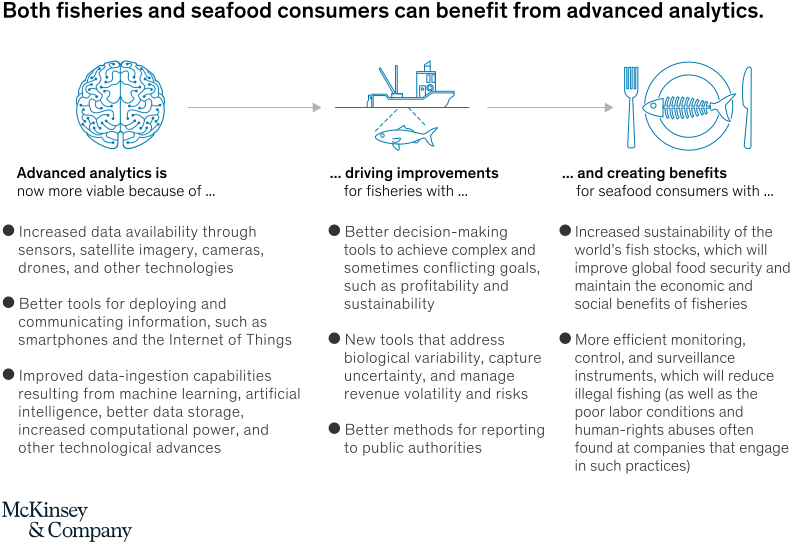
Since regulations alone cannot eliminate overfishing, fisheries need other solutions to stay on a sustainable trajectory while minimizing their environmental impact. For most issues, including catch reporting, trade-information sharing, subsidies, tariff policies, and regulation enforcement, greater national and international collaboration will help. But fisheries and the public could also benefit from the increased use of advanced analytics (Exhibit 3). These algorithms have become popular across industries over the past few years as technological improvements have increased data availability, facilitated the deployment of information, and expanded data-ingestion capabilities.
Exhibit 3
We strive to provide individuals with disabilities equal access to our website. If you would like information about this content we will be happy to work with you. Please email us at: McKinsey_Website_Accessibility@mckinsey.com
Many industry stakeholders have already incorporated advanced analytics into all components of the value chain. Here’s a look at some of the most important recent developments relevant to fisheries.
Data acquisition through sensing platforms
Sensors for collecting data have become more common, compact, and less expensive over the past few years. At the same time, the variety of platforms on which these devices can be deployed has considerably expanded, allowing them to capture data more rapidly and over greater distances. Sensing platforms that are particularly important within the fishing industry include the following:
Satellite. Optical and radar sensors on satellites can offer a holistic view of the environment at unprecedented spatial and temporal resolution, making them particularly valuable for monitoring purposes. Optical sensors measure the light reflected by the earth’s surface across a wide range of the electromagnetic spectrum. Important oceanic parameters can be derived from such data, including sea temperature and turbidity. Radar sensors emit microwave radiation and measure the portion that is scattered back to the instrument. They can provide data about ocean topography, winds, sea ice, and the movement of vessels. Unlike optical sensors, radar systems can collect information even during poor weather and lighting conditions, including times when the sky is dark or cloudy.
Drones. Equipped with cameras or other sensing devices, drones are increasingly used to explore the ocean. Some are even capable of navigating underwater. Compared with oceanographic vessels, drones are cheaper and more flexible. When sent in groups, they can also provide a more exhaustive sampling of the environment.11 Although drones cover a smaller area than satellites, they can provide more detailed images, allowing them to detect smaller objects or phenomena.
Onboard or underwater devices. Data related to fishing operations and catch are typically recorded by fishermen or observers. Common parameters include those related to vessel location, gear types, and catch, including species, volume, biophysical characteristics, and discards. Onboard sensors can automate and facilitate this laborious process while simultaneously generating more exhaustive and reliable data. The data are then integrated into platforms known as electronic monitoring systems (EMSs). Several fishing-management authorities also require large fishing vessels to be equipped with vessel-monitoring systems (VMS), a technology that the European Union established in the early 2000s to support the monitoring, control, and surveillance of fishing vessels in its waters. VMS can collect information on a vessel’s position, speed, and heading. Vessel operators can also send valuable information to authorities through their VMS, such as estimated catch and the start and end times for their fishing operations. Another onboard utility, the automatic identification system (AIS), was designed to complement radar systems and decrease the likelihood of marine collisions. Like VMS, it can be used to track the activity of fishing vessels. Other sensors, such as cameras and fuel-monitoring systems, can also be placed on board or next to underwater nets for real-time tracking.
Public organizations such as the National Oceanic and Atmospheric Administration and the Copernicus Marine Environment Monitoring Service have increased the effective usage of data obtained from satellite sensors by freely publishing them. Many start-ups and other companies also offer various products related to sensing platforms, including output from satellite sensors and data-collection systems designed for commercial fisheries.
Improved data-transmission technologies
The growth of the Internet of Things (IoT), land- and satellite-based mobile networks, and smartphones makes it much easier for fisheries to transmit data from vessels for analysis. For instance, vessels can use IoT to monitor and transmit data on fuel consumption in real time. The resulting data are then sent ashore through wireless mobile networks, including 3G and 4G, when close to shore. At further distances, vessels rely on satellite networks for transmission.
The growth of the Internet of Things (IoT), land- and satellite-based mobile networks, and smartphones makes it much easier for fisheries to transmit data from vessels for analysis.
More insightful data analysis
Computational power has increased substantially, making it easier to process and analyze information using sophisticated algorithms. Across industries, some of the most important advances relate to the rise of artificial intelligence and machine learning, which can identify hidden relationships in large amounts of data. In particular, image-recognition and object-detection tools, powered by deep learning, have made a significant leap forward during the past decade. For instance, onboard cameras, assisted by image-recognition software, can provide fishermen with important information on the content of their catch in real time, including species, volume, and fish size.
Fishing-industry stakeholders are already transforming their operational and business processes by incorporating AA into all parts of the value chain, including fishery management, detection and capture, processing, reporting, and surveillance and control (Exhibit 4). They typically use multiple AA tools and sensors in combination, and a few even apply them from end to end within the value chain (see sidebar, “How are fisheries exploring new technology? An interview with Matts Johansen, CEO of Aker BioMarine Antarctic”). We have found that in some of the most important use cases involving AA and fishing, the following actions have been taken.
Exhibit 4
We strive to provide individuals with disabilities equal access to our website. If you would like information about this content we will be happy to work with you. Please email us at: McKinsey_Website_Accessibility@mckinsey.com
Monitoring illegal, unreported, and unregulated fishing
Authorities leverage AA to combat illegal, unregulated, and unreported fishing using geolocation data from AIS and VMS. AA can predict whether fishing vessels are actively engaged in fishing by looking at their AIS speed and course profile. For example, a vessel that slows down to one to three knots and frequently changes direction would likely be fishing. If geolocation data are not available, AA can also determine the position of vessels through image-recognition algorithms and satellite imagery (both radar and optical) that allow authorities to monitor the fishing fleet directly from space and detect any suspicious activity under their purview, such as fishing in restricted zones or the offloading of fish cargo from one vessel to a refrigerated transport vessel—a practice that is sometimes used to conceal a catch from authorities.
Some industry organizations also use sensor data to monitor fishing activity, with the goal of increasing sustainability, such as Global Fishing Watch, a not-for-profit organization that aims to increase transparency by offering free data about the activity of the global fishing fleet based on AIS, VMS, and satellite imagery.12
Improving the detection of fish
Most fisheries have scarce data about their target catch. They might assess stock yearly, rather than making more frequent observations, and their analyses focus on information about landed catches and data recorded by observers. Tools that incorporate advanced analytics can provide a more dynamic, reliable, and nuanced view of the fluctuating ocean environment.
Consider patterns related to fish aggregation and migration, which change in response to temperature, wave height, the presence of sea ice, and other ocean conditions. Fisheries can monitor these changes through satellite imagery obtained from sensors. Complemented with information from other sources, such as the location of fishing vessels and catch data, advanced analytics can help determine the distribution and migratory patterns of a target species over time and space with greater accuracy and frequency.
Some researchers have already applied advanced analytics to get better information on the distribution of fish. One team developed high-resolution predictive models by combining various ocean data, including sea-surface temperature, wind speed, and chlorophyll levels associated with plankton, with information obtained from fisheries and tagging sensors. The models provide daily recommendations about where to fish and how to avoid bycatch, increasing efficiency.13 With a more detailed and dynamic vision of fish stocks, fishing companies can decrease the amount of time, effort, and fuel required for each catch. Likewise, authorities can use the data to improve resource management.
Reporting to authorities and central managers
As noted earlier, fishermen and independent observers typically monitor and report fishing activities themselves. The results are then sent to relevant authorities or central managers within their company. EMS can automate and facilitate this time-consuming process to generate more exhaustive and reliable data based on sensor input. These systems typically consist of cameras connected to a GPS receiver and other vessel-tracking devices, such as engine-monitoring sensors that send data on fuel consumption in near real time. As fishing companies evolve toward a more data-rich environment, advanced analytics will become more and more relevant. Eventually, fishing companies will be able to combine data in ways that deliver new insights about key operational-performance drivers, such as fuel consumption and fish-catching rates.
Traceability
The supply chain in the seafood industry is complex, opaque, and lacking in international harmonization because the stakeholders involved often closely guard their information. 14 The lack of clarity makes it easier for vessels to skirt regulations and fish illegally. It also frustrates consumers, who are increasingly asking for more information about the source and freshness of the food on their plates.
The supply chain in the seafood industry is complex, opaque, and lacking in international harmonization because the stakeholders involved often closely guard their information.
To improve transparency, some researchers are investigating distributed-ledger technologies that track and store information on transactions, including data on the movement of goods along the supply chain, in a secure, distributed database. Although distributed-ledger technologies are not classified as advanced-analytics tools, they are an important enabler. The information in a distributed-ledger technology database, including insights from advanced analytics, is available to all approved users in real time.
Researchers are also investigating other technologies for tracking seafood, such as radiofrequency-identification tags and quick response codes, both of which transmit product information when scanned. With tagging, fishing companies may find it easier to receive permission to place labels on their products certifying that they are approved by the Marine Stewardship Council and other organizations that guarantee a product has been sustainably sourced, monitored along the supply chain, and correctly labeled. Consumers may increasingly look for such labels, giving an advantage to those that fish responsibly.
Although commercial fishing companies are exploring advanced analytics through pilots and other activities, their decisions about where, when, and how to fish are still largely based on intuition and experience. Similarly, most regulators are not taking full advantage of advanced analytics. They have collected and analyzed some data, but their information is often incomplete and prone to inaccuracies, especially in emerging markets.
With all industry stakeholders concerned about fishing stocks, it is now time to take a more aggressive approach to advanced analytics. As noted earlier, recent technological advances will facilitate this push, since costs for data storage and processing are decreasing each year. Their greater affordability means that most fishing companies and other stakeholders can now afford to implement more advanced-analytics tools in the near future. Likewise, talent recruitment will become less difficult for fisheries since the supply of data scientists, engineers, and technicians is growing. Fisheries will still face more challenges in acquiring talent than well-known tech companies or other industries that have traditionally promoted advanced analytics, but the recruitment pool will be larger.
Fishing companies
To guide their advanced-analytics journey, fishing companies must create a road map focusing on challenges they hope to address, such as those related to fishing efficiency, capture volatility, and fleet monitoring. To identify quick wins, companies should first assess their data stores to see what information is readily available. Most will find that they already have much relevant information on hand, including vessel-specific data on daily catch (both volume and species), GPS position, and fuel consumption.
Although commercial fishing companies are exploring advanced analytics through pilots and other activities, their decisions about where, when, and how to fish are still largely based on intuition and experience.
Simple yet powerful use cases could be built around such data. Rather than using this information for purely descriptive purposes—for instance, noting the average catch for each vessel during past months—fishing companies could adopt a forward-looking analytical approach. One analysis might involve using geospatial modeling to map fishing activity and catch rate over the course of the season, allowing fisheries to track the fleet more closely and gain a better understanding of performance drivers. Increased fishing efficiency would also reduce fuel consumption and running costs. In addition to such simple analyses, fishing companies could use geospatial modeling to predict the location of targeted fish according to various environmental conditions. Such tools could inform not only fishing operations but also downstream commercial activities, including seafood pricing and labeling.
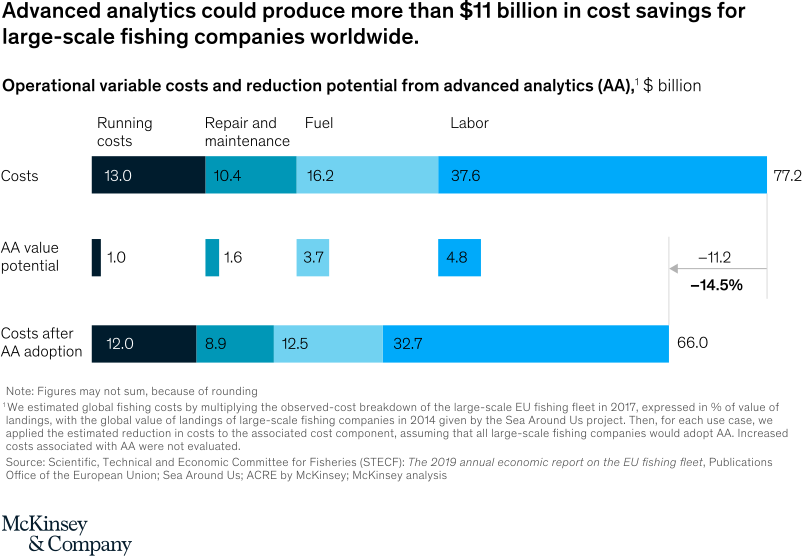
Fishing companies will also find many other use cases for advanced analytics. For example, they could generate even greater fuel savings by examining data from IoT sensors that provide information on vessel behavior, including fuel consumption and navigation conditions. Their analyses could help them generate real-time recommendations about the most energy-efficient routes and maneuvers. Similarly, fishing companies could examine data from onboard sensors to determine if any equipment is experiencing the sorts of problems that typically occur before a breakdown. With this information, they could detect potential failures ahead of time, thereby preventing costly repairs and long downtimes. In an analysis of large fishing companies worldwide, we estimated that using advanced analytics could produce more than $11 billion in savings by reducing running costs, as well as expenses for fuel, labor, and repair and maintenance (Exhibit 5).
Exhibit 5
We strive to provide individuals with disabilities equal access to our website. If you would like information about this content we will be happy to work with you. Please email us at: McKinsey_Website_Accessibility@mckinsey.com
While these potential gains are impressive, fishing companies will not achieve them by simply implementing advanced-analytics initiatives. Instead, they must undertake an end-to-end digital transformation throughout all their functions.15 Such transformations require employees to have the right skill sets, as well as appropriate tools, processes, and interfaces (for instance, dashboards where they can readily access data). In addition, organizations should provide training and support to help employees see the value of advanced analytics, especially if they appear reluctant to change their ways. Without this support, employees may view advanced analytics as an imposition—a mind-set that is likely to impede progress.
Government and fishery-management agencies
Advanced analytics can increase transparency about seafood from ocean capture to the dinner table
With fish stocks dwindling and environmental challenges mounting, governments and fishery-management agencies could consider investing in data-collection technologies and research programs that can provide a comprehensive, near real-time vision of both ocean resources and fishing activities. By leveraging the data, they can adopt new measures and regulations more quickly and also rapidly respond to external pressures such as climate change. Fishing quotas could also become more dynamic. Rather than setting a quota annually, at the beginning of the fishing season, authorities could make adjustments throughout the year based on real-time information about the amount and type of catch that vessels are collecting.
The current exchange of information between fishermen and authorities is not optimal.16 A collaborative problem-solving approach—potentially happening at the global or regional level—is needed to develop a clear road map defining data standards and mutual goals, such as those for by catch reduction. These efforts would build trust among stakeholders and benefit all.
Food companies
By improving both the monitoring of fishing activities and the reporting of associated catches, advanced analytics can increase transparency about the seafood supply chain from ocean capture to the dinner table. Food companies can share this information with consumers, who have a growing interest in the quality, traceability, and sustainability of food products. In addition to their own health, they are concerned about environmental impact. If advanced analytics reveals that most of a company’s catch comes from endangered species or overfished areas, the company can shift to other options to increase sustainability (either moving its own fishing fleets or changing suppliers). Certain technologies, including distributed-ledger technologies and radio-frequency-identification tags, can help companies share their insights about catch origin more efficiently and might merit additional investment.
Modern farmers already rely on sophisticated weather forecasts, sensors, and geospatial tools to optimize their harvest and manage land more sustainably. Now it’s time for fishing companies and other stakeholders to start their own digital and analytical journey. Getting fuller nets and larger fish is one goal, but a more important objective relates to sustainability. As fish stocks drop and fishing companies expand their reach, advanced analytics may be one of the best tools for protecting endangered species and other ocean resources. While data and algorithms may seem a better fit for boardrooms than boats, some fisheries have already achieved major gains by applying them. It’s now time for more widespread adoption before the environmental consequences of overfishing accelerate.
,
Read More » Posted in Satellite, Sensors, Water | Comments Off on Precision Fisheries: Navigating A Sea of Trouble With Advanced Analytics
Via CXO Today, a look at how the Internet of Things may be used to support bird conservation:
India is a biodiversity hotspot and home to over 1300 species of birds. While, these beautiful creatures are vital in maintaining the overall ecological balance, their natural habitats are increasingly under threat. A recent report, State of the World’s Birds 2018, found that one in eight birds is in danger of extinction, and 40% of the world’s 10,000+ species are declining thanks to climate change, logging, industrial farming and various other factors. Hence there is a pressing need to build an impactful and scalable conservation model, so as to engage more people, organizations and communities working in this space.
Realizing the urgency to identify and preserve birds as well as spread awareness in this area, IT consultancy firm Accenture has developed an Artificial Intelligence (AI)-based Birds platform – a first of its kind in India – that identifies bird species found in the country, in association with the Bombay Natural History Society (BNHS), a non-governmental wildlife research organization.
In an engaging conversation with CXOToday, Sanjay Podder, Managing Director at Accenture Labs (Asia Pacific) explains the technology and the rationale behind this initiative.
“We realized that most people find it difficult to identify rare birds unless they are experts or have read books on ornithology. While our country is home to a spectacularly diverse set of birds, it lacked a large centralized repository to help amateur bird lovers and conservationalists accurately identify them. This is when Accenture Labs started working with BNHS to design and develop the Internet of Birds platform,” he says.
Based in Mumbai, BNHS has been working on nature conservation and research projects in the sub-continent for the last 136 years. Launched initially as a web portal, Accenture has recently launched a mobile application for BNHS, which extends the functionality of the platform to mobile devices. The Internet of Birds platform initially identified nearly 100 species of birds in India, and can now identify nearly 700.
On the technology behind the concept, Podder says, “Internet of Birds is a cloud-based, image recognition and deep learning platform which uses AI, including machine learning and computer vision. The platform has been trained on birds found in the Indian subcontinent using a convolutional neural network, which is a deep learning algorithm that can take in an image and assign importance to various aspects in the image, with the ability to differentiate between images.”
He adds that it also uses a unique citizen crowd sourcing approach under which bird watchers can contribute to the platform by uploading information on rare birds that they come across. Data from BNHS helps confirm the identity of the birds and trains the application’s deep learning model. Each time a picture is contributed to the system, it teaches itself, increasing the platform’s accuracy in the recognition of bird species.
“In addition, its AI at the edge functionality enables mobile access to the information in remote locations such as deep jungles with poor or no internet connectivity,” says Podder.
Accenture Labs in Bangalore has provided pro-bono services to BNHS to design and build the Internet of Birds platform as part of its broader corporate focus on using technology for good. The IT firm’s Tech4Good program leverages emerging digital technologies and works with social innovators, academia, startups and government to address sustainable development goals across education, health, environment, inclusion and diversity.
Asked if the Internet of Birds use case can be replicated for other conservation solutions that leverage image identification, Podder says, “The AI at the edge functionality of the app could potentially be used in scenarios where connecting to the cloud introduces a lag or is simply not possible due to lack of connectivity.”
“The model can be applied to explore locations that are either inaccessible or hazardous for human beings such as in mines, underwater, or in space, and can be used in a variety of mission-critical industry use cases that enable safety, equipment diagnostics and troubleshooting.”
Needless to say, advanced technology is enabling new ways of mining data in the wildlife preservation activities around the world. In India, the concept is relatively nascent. There’s still a long way to go in terms of new product development and research.
While more research is going on in areas, such as IoT, big data, and advanced analytics for species protection and the public good in a scalable and sustainable manner, the Internet of Birds is a powerful example of how technology such as AI and deep learning can help drive innovation that benefits our communities and our planet.
,
Read More » Posted in Open Source, Sensors | Comments Off on Internet of Birds: Harnessing AI for Bird Tracking, Conservation
New technical innovations such as location-tracking devices, GPS and satellite communications, remote sensors, laser-imaging technologies, light detection and ranging” (LIDAR) sensing, high-resolution satellite imagery, digital mapping, advanced statistical analytical software and even biotechnology and synthetic biology are revolutionizing conservation in two key ways: first, by revealing the state of our world in unprecedented detail; and, second, by making available more data to more people in more places. The mission of this blog is to track these technical innovations that may give conservation the chance – for the first time – to keep up with, and even get ahead of, the planet’s most intractable environmental challenges. It will also examine the unintended consequences and moral hazards that the use of these new tools may cause.Read More