Via World Economic Forum, a look at how data and technology can help tackle the globe’s water pollution challenge:
Humans have wrestled with water quality for thousands of years, as far back as the 4th and 5th centuries BC when Hippocrates, the father of modern medicine, linked impure water to disease and invented one of the earliest water filters. Today, the challenge is sizeable, creating existential threats to biodiversity and multiple human communities, as well as threatening economic progress and sustainability of human lives.
Increasing the economic and human cost of toxic water-bodies
To set up effective interventions to clean rivers, decision-makers must be provided with reliable, representative and comprehensive data collected at high frequency in a disaggregated manner. The traditional approach to water quality monitoring is slow, tedious, expensive and prone to human error; it only allows for the testing of a limited number of samples owing to a lack of infrastructure and resources. Data is often only available in tabular formats with little or no metadata to support it. As such, data quality and integrity are low.
Using automated, geotagged, time-stamped, real-time sensors to gather data in a non-stationary manner, researchers in our team at the Tata Centre for Development at UChicago have been able to pinpoint pollution hotspots in rivers and identify the spread of pollution locally. Such high-resolution mapping of river water quality over space and time is gaining traction as a tool to support regulatory compliance decision-making, as an early warning indicator for ecological degradation, and as a reliable system to assess the efficacy of sanitation interventions. Creating data visualizations to ease understanding and making data available through an open-access digital platform has built trust among all stakeholders.
Pictorial representation of a non-stationary, real-time sensor system with cloud-based data storage and digital dissemination capabilities
How machine learning can produce insights
Beyond collecting and representing data in easy formats, there is a possibility to use machine learning models on such high-resolution data to predict water quality. There are no real-time sensors available for certain crucial parameters estimating the organic content in the water, such as biochemical oxygen demand (BOD), and it can take up to five days to get results for these in a laboratory. These parameters can potentially be predicted in real-time from others whose values are available instantaneously. Once fully developed and validated, such machine learning models could predict values for intermediary values in time and space.
Real-time application of a neural network to easily available parameters to predict other water quality indicators
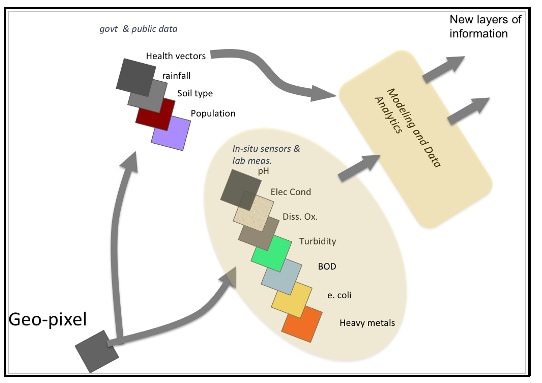
Furthermore, adding other layers of data, such as the rainfall pattern, local temperatures, industries situated nearby and agricultural land details, could enrich the statistical analysis of the dataset. The new, imaginary geopixel, as Professor Supratik Guha from the Pritzker School of Molecular Engineering calls it, has vertical layers of information for each GPS (global positioning system) location. Together they can provide a holistic picture of water quality in that location and changing trends.
The new imaginary geopixel, as Professor Supratik Guha from the Pritzker School of Molecular Engineering calls it, has vertical layers of information for each geotagged location
Technology and public policy
In broad terms, machine learning can help policy-makers with estimation and prediction problems. Traditionally, water pollution measurement has always been about estimation – through sample collection and lab tests. With our technology, we are increasing the scope and frequency of such estimation enormously – but we are also going further. With our machine learning models, we are trying to build predictive models that would completely change the scenario of water pollution data. Moreover, our expanded estimation and prediction machine learning tools will not just deliver new data and methods but may allow us to focus on new questions and policy problems. At a macro level, we aim to go beyond this project and hope to bring a culture of machine learning into Indian Public Policy.
Data disclosure and public policy
Access to information has been an important part of the environmental debate since the beginning of the climate change movement. The notion that “information increases the effectiveness of participation” has been widely accepted in economics and other social science literature. While the availability of reliable data is the most important step towards efficient regulation, making the process transparent and disclosing data to the public brings many additional advantages. Such disclosure creates competition among industries on environmental performance. It can also lead to public pressure from civil society groups, as well as the general public, investors and peer industrial plants, and nudge polluters towards better behaviour.
,
Read More » Posted in Satellite, Water | Comments Off on How Technology and Reliable Data Can Help Tackle Water Pollution
Via Space Daily, a report on a new satellite based sensor to help marine conservation:
Four tiger sharks have been tagged with a new device that will help conservationists to conduct detailed analysis of their migrations over years.
The device, developed in collaboration with ESA, is smaller and more durable than existing tags, as well as being cheaper and more animal friendly.
It records pressure – indicating the depth of the shark – temperature, light level and tilt to enable three-dimensional mapping.
The tiger sharks were tagged off the coast of Saba in the Dutch Caribbean, during an expedition organised by the Dutch Elasmobranch Society, the Saba Conservation Foundation and Nature Foundation Sint Maarten.
“It’s important to track these animals over an extended period of time, as their migratory patterns can be long and far. Ideally you want to track them for several years,” says Irene Kingma of the Dutch Elasmobranch Society.
“The potential of the new technology used in these tags is amazing as it allows us to collect more data for a longer period of time.
“As ESA has the objective to have the tags produced at a considerably lower price point than the current tags on the market, this could change the way tagging is done in the future,” she says.
The tags communicate with passing satellites. This is known as “a handshake” and takes only minimal power – about the equivalent of sending a text message from a mobile phone.
Once the first contact has been made, the information is transferred. On receiving an acknowledgment from a satellite that its data has been received, the tag stops retransmitting.
This efficiency draws less battery power, making the tag last up to five times longer than existing devices that repeatedly retransmit their information.
The smaller and lighter tag can also hold more data. In fact, once the information has been uploaded to the satellite, the tag can clear its memory and start collecting new readings.
The results so far have shown that the device is highly accurate and robust.
“This technology opens the door to brand new possibilities. Currently tiger sharks are observed infrequently and it is difficult to say where they are. We don’t know about their breeding grounds or where they go,” says Tadzio Bervoets, director of the Nature Foundation Sint Maarten, who is charge of the tagging.
“With this revolutionary new tag we are able to better determine the migratory patterns of these critically important yet threatened apex predators and enact management solutions throughout their migratory range within the Caribbean basin.”
ESA worked with AnSem in Belgium under its programme of Advanced Research in Telecommunications Systems (ARTES) to develop the Artic microchip used in the devices. It was built into a marine tag manufactured by Star Oddi in Iceland.
The tag works in conjunction with the Argos satellite monitoring system operated by CLS in France, a leading provider of satellite services for environmental and maritime applications.
“The two-way link with the satellite is the key,” says ESA’s Peter de Maagt, who was also on the expedition.
“The increased efficiency has had knock-on benefits that have opened up new opportunities for better, less invasive tracking.
“This makes it easier to monitor how wildlife is coping in our fast-changing environment.”
,
Read More » Posted in Satellite, Sensors | Comments Off on Satellite-Connected Tags Set To Boost Marine Conservation
Via Terra Daily, a look at the use of satellites to track changes in the world’s water:
Water is so commonplace that we often take it for granted. But too much – or too little of it – makes NASA explores our changing freshwater worlds.
Catastrophic flooding in the U.S. Midwest this spring has caused billions of dollars in damage and wreaked havoc with crops, after rain tipped off a mass melting of snow. Seven years of California drought so debilitating that it led to water rationing came to a close after a wet and snowy winter capped off several years of slow rebound and replenished the vital mountain snowpack.
Half a world away, drought in eastern Australia so depleted the wheat crop that it had to be imported for the first time in 12 years. In eastern Africa and the Middle East, some of the most severe drought conditions on Earth are contributing to stressed crops across Somalia, Sudan, and Yemen.
Whether concerned with floods, droughts, or the status and quality of water supplies, addressing the water-related needs of humans on Earth starts with knowing where the water is. With unique views from space, NASA is at the forefront of studying and monitoring this most precious resource that is constantly on the move.
Researchers use data from satellites, aircraft, and other efforts, to find out where and when water is available around the globe, how much, and how are those patterns changing. They then figure out how to best use that data and get it into the hands of the people who need it most.
Over the next few weeks, we’ll be exploring areas of NASA research into Earth’s freshwater and surveying how those advances help people solve real world problems.
NASA and its partners are using satellites to revolutionize our ability to track and understand the flow of freshwater around Earth – whether it is in the atmosphere, at the Earth’s surface, or underground. In the last two decades, freely available NASA datasets have been used for extensive research into the movement, distribution, and interaction of each part of the water cycle worldwide.
It’s a complex cycle: Evaporating from warm tropical oceans, freshwater condenses into clouds, circulating on the winds where a portion of it falls as rain or snow. On the ground, freshwater is stored in ice, snow, rivers and lakes. Or, it soaks into the ground, disappearing from view to infiltrate into soils and aquifers. Or, before it disappears from view, it can evaporate back to the atmosphere, where moisture is tightly related to Earth’s energy flow, which in turn influences weather patterns that govern freshwater’s distribution.
“Fresh water is critically important to humans, both in obvious ways and in unseen ways such as moving heat around Earth’s entire climate system,” said Jared Entin, terrestrial hydrology program manager in the Earth Science Division at NASA Headquarters, Washington. “With our current satellites, we are now making great progress in pinning down both the detail needed for local water decisions and the global view essential to better understanding our changing climate.”
Researchers funded by NASA have used satellite and airborne data to better inform existing tools for flooding, drought forecasts and famine relief efforts, and for planning and monitoring regional water supplies. These efforts are tackling some of the most pressing needs of people around the world.
These efforts are shaped by local geography and specific user needs to ensure they address freshwater data that are most valuable to communities. For this reason, NASA supports a number of water-management applications that are customized to support different regions. For example, NASA’s Western Water Applications Office works with various entities in the western U.S., including state governments, tribal nations, and private industries to track the impacts of drought on agriculture and general water supplies.
Abroad, NASA partners with the U.S. Agency for International Development through the SERVIR program to provide satellite data, computing tools, and training to local partners that improve local flood forecasting in Africa and assess climate impacts on mountain snow packs in the Himalayas, among other efforts.
These programs are but a few examples of many NASA-supported projects. Hundreds of other researchers, government agencies, and non-profits develop their own water-management tools and applications using NASA’s free and open datasets.
Water from Snow NASA is improving on existing and developing new remote sensing methods that can reveal how much water is stored in mountain and seasonal snowpack – one of the world’s most vital sources of freshwater. More than a billion people, spanning multiple continents, rely on water from mountain snow for their water supplies that support drinking water, farming, and even hydroelectric power.
Snowfall patterns shift over time, however, both year-to-year from natural variability and due to long-term climate effects. With persistent human demands, the ability to accurately measure how much water is in mountain snowpack becomes an even more critical capability.
Through the Airborne Snow Observatory program, NASA and California’s Department of Water Resources use instruments mounted on airplanes to create high resolution estimates of snow water content for priority watersheds in the Western U.S. The collected data helps determine the timing of the spring melt, which has downstream effects on hydroelectric power generation and planning for how much water can be held in reservoirs.
NASA is also focused on the long-term development of tools to measure water in snow through an airborne field campaign called SnowEx. This type of field campaign connects detailed measurements of snow in the Colorado Rocky Mountains taken by researchers on the ground to remote sensing observations made by aircraft flying over the ground sites. The connections made from these highly detailed datasets will help scientists design future satellite missions that will make similar measurements from space.
Airborne snow measurements, as well as other programs, complement long-term regional observations from NASA satellites that create estimates for entire mountain ranges in the Western U.S. and around the world.
Water in the Sky When we think of water on Earth we may think of the ocean, rivers and lakes. But as water cycles around the planet, the atmosphere holds moisture, creating a reservoir in the sky that periodically condenses into rain and snow.
NASA is part of a team from more than a dozen countries whose satellites are working together to deliver global rainfall data every half hour. Over land, rain has immediate impact as it soaks into the ground, which supports crops.
Rainfall data is one of the most essentia toolsl for monitoring freshwater’s movement around the planet, and goes into applications that touch people’s everyday lives, including weather forecasting, crop monitoring, and flood prediction.
For many parts of the world, especially developing countries and hard-to-reach terrain where ground measurements are sparse to non-existent, these global NASA datasets are sometimes the only consistent source of information on rainfall and soil moisture.
Water from Below NASA satellites monitoring Earth’s gravity field have given scientists insight into the movement of large masses such as ice and water – including water hidden underground. This global look at changes to the amount of water storied in aquifers, massive underground freshwater reservoirs, has revealed some concerning trends. Of the 37 largest aquifers on Earth, a third of them are being depleted by communities pumping the water faster than it recharges from rainfall.
These water declines occur primarily where agriculture and aquifers coincide, and where human water demands can easily exacerbate conditions of periodic drought. Among those most stressed in the past decade are the Central Valley of California, the Indus Basin in northwestern India and Pakistan, and the Arabian Aquifer System in Saudi Arabia.
About 70% of all freshwater on Earth is used for irrigated agriculture. Underground aquifers are water sources that act like waiting bank savings accounts, providing a dependable supply and making agriculture possible in arid areas where significant rain events may only occur once a year and during droughts when surface water is scarce.
We do not know the full extent of these underground water aquifers or when they may run dry, but understanding the change in available water that occurs both seasonally and throughout the satellite record helps decision-makers manage their resources.
In addition to witnessing the effects of agriculture, the satellite data show the effects of climate change, most notably in the decline of sea ice and ice sheets at the poles. They also observe the ups and downs of more natural variability that reflects a region’s span of wet or dry years.
As the global satellite record extends into the future, researchers and water managers will continue to monitor freshwater hidden below as climate patterns shift and human demands grow.
Via Vox, an interesting look at the use of satellite imagery to precisely track the air pollution (including carbon emissions) coming out of every single power plant in the world:
Earlier this month brought a mind-blowing announcement in the world of power plants and pollution.
In a nutshell: A nonprofit artificial intelligence firm called WattTime is going to use satellite imagery to precisely track the air pollution (including carbon emissions) coming out of every single power plant in the world, in real time. And it’s going to make the data public.
This is a very big deal. Poor monitoring and gaming of emissions data have made it difficult to enforce pollution restrictions on power plants. This system promises to effectively eliminate poor monitoring and gaming of emissions data.
And it won’t just be regulators and politicians who see this data; it will be the public too. When it comes to environmental enforcement, the public can be more terrifying and punitive than any regulator. If any citizen group in the world can go online and pull up a list of the dirtiest power plants in their area, it eliminates one of the great informational barriers to citizen action.
And citizens have reason to organize. According to the latest State of Global Air report, air pollution is the fifth greatest global mortality risk. It causes 5 million early deaths and 147 million years of healthy life lost, every year, and the countries building the most power plants are experiencing the most air pollution. Their citizens have the most on the line. And now they’ll be armed with information.
Things are about to get interesting. Let’s look at the details.
Eyes in the sky will track all power plant pollution
The plan is to use data from satellites that make theirs publicly available (like the European Union’s Copernicus network and the US Landsat network), as well as data from a few private companies that charge for their data (like Digital Globe). The data will come from a variety of sensors operating at different wavelengths, including thermal infrared that can detect heat.
The images will be processed by various algorithms to detect signs of emissions. It has already been demonstrated that a great deal of pollution can be tracked simply through identifying visible smoke. WattTime says it can also use infrared imaging to identify heat from smokestack plumes or cooling-water discharge. Sensors that can directly track NO2 emissions are in development, according to WattTime executive director Gavin McCormick.
Between visible smoke, heat, and NO2, WattTime will be able to derive exact, real-time emissions information, including information on carbon emissions, for every power plant in the world. (McCormick says the data may also be used to derive information about water pollutants like nitrates or mercury.)
Who’s behind it
Google.org, Google’s philanthropic wing, is getting the project off the ground (pardon the pun) with a $1.7 million grant; it was selected through the Google AI Impact Challenge.
WattTime, a nonprofit that is now a subsidiary of the Rocky Mountain Institute, made a splash earlier this year with Automated Emissions Reduction. AER is a program that uses real-time grid data and machine learning to determine exactly when the grid is producing the cleanest electricity. It can then automatically adjust power consumption to match up with those times, ensuring that users take advantage of the lowest-carbon power available. (Many kinds of power consumption can be safely shifted in time, like water heaters, battery charging, and some industrial processes; they are “dispatchable.”) AER is, as the name indicates, entirely automated; it works behind the scenes, without any user intervention.
WattTime is partnering with Carbon Tracker, a think tank that’s done previous work with satellite imagery, using it for financial analysis of power plants (including a pioneering studyshowing that 42 percent of global coal power plants are operating at a loss), and the World Resources Institute, which operates the world’s most comprehensive Global Database of Power Plants.
WattTime is a mission-based nonprofit with a track record, legitimate partners, and serious financial backing. Despite its diminutive size, it has a chance of becoming the global clearinghouse for transparent, reliable pollution data.
What it will immediately enable
This information is going to empower all kinds of tools and avenues for pollution reduction. Here are a few McCormick mentioned to me:
Every pollution law or international agreement relies on monitoring and verification. Many countries, or areas within countries, are suspected of underreporting emissions. It creates a background level of mutual mistrust. Now there will be a trusted, third-party source of verified information on every power plant; no more gaming the system by fiddling with local monitoring equipment or misreporting emissions. Transparent third-party verification will raise everyone’s confidence in the ability of regulators and negotiators to produce results.
Remember Automated Emission Reductions? Real-time pollution data will enable AER to work anywhere in the world, without undue reliance on state or industry sources of data. I’ve written before about how battery storage doesn’t always reduce carbon emissionson the grid, because it’s rarely timed to sync up with clean energy. California is trying to fix that problem. AER will make it easier, for California and everyone else, to match clean energy production and consumption.
Real-time, public pollution data will help renewable energy developers site their projects in areas where they can maximize emission reductions.
Carbon Tracker has already shown that satellite data can be used for more precise financial analysis of power plants (again: 42 percent of the coal plants in the world are operating at a loss). WattTime’s program will make that analysis more robust and help better identify those areas where renewable energy is already cheaper than fossil power.
Finally, the data will help fill in the gaps even in US pollution monitoring, which are many.
All that stuff will crank up the minute the information becomes public. WattTime is currently gathering data and working with partners who will put the information to use.
But the really interesting stuff will happen after this data is unleashed on the world and becomes accessible everywhere.
What it could enable in the long term
To help illuminate the larger impact this information might have, indulge me in a brief anecdote.
In 1986, the US created the Toxic Release Inventory, a database tracking the toxic emissions of all US industrial facilities.
It was strengthened in 1990, as part of the Pollution Prevention Act. At the time, this outcome was seen as something of a failure — the originally proposed bill contained stiff penalties for toxic emissions, but they were stripped out in negotiations. In the end, all that was left was the information, the TRI itself.
But the TRI has gone on to prove one of the most effective environmental regulations in US history. Simply making the information available to the public empowered citizens, nonprofits, and state governments to organize pressure on the worst emitters. In the five years after it was implemented, toxic emissions fell by almost half.
The TRI enabled what scholars Archon Fung and Dara O’Rourke (of Harvard and MIT, respectively) have called ‘‘populist maximin regulation,” which differs from conventional command-and-control regulation in four ways. First, the role of government agencies “is not to set and enforce standards, but to establish an information-rich context for private citizens, interest groups, and firms to solve environmental problems.”
Second, standards are not set according to expert risk analysis, but according to what the public is willing to accept. Third, emitters “adopt pollution prevention and abatement measures in response to a dynamic range of public pressures rather than to formalized agency standards or governmental sanction.” Finally, the information allows public attention to focus on the worst emitters — maximum attention on minimum performers, thus “maximin.”
A shorter way of putting this: Once the public knows what polluters are up to, it stops letting them get away with it.
Just as the TRI enabled populist maximin regulation in the US — a wave of bottom-up activism that the authors of the TRI never anticipated — so could WattTime’s data be used to organize citizen pressure on the biggest carbon emitters, on a global scale.
If nothing else, the biggest polluters, and the biggest cheaters, will be exposed. No company, no country, will be able to hide or fudge its numbers. The public will know how to find them.
,
Read More » Posted in Satellite | Comments Off on Satellite Data + AI = No Place For Polluters To Hide
Scientists from The Australian National University (ANU) have used new space technology to predict droughts and increased bushfire risk up to five months in advance.
ANU researcher Siyuan Tian said the team knew they needed to move into space to get closer to understanding the complex nature of drought.
They used data from multiple satellites to measure water below the Earth’s surface with unprecedented precision, and were able to relate this to drought impacts on the vegetation several months later.
“The way these satellites measure the presence of water on Earth is mind boggling,” said Ms Tian from the ANU Research School of Earth Sciences.
“We’ve been able to use them to detect variations in water availability that affect the growth and condition of grazing land, dryland crops and forests, and that can lead to increased fire risk and farming problems several months down the track.”
Co-researcher Professor Albert van Dijk said combining these data with a computer model simulating the water cycle and plant growth enabled the team to build a detailed picture of the water’s distribution below the surface and likely impacts on the vegetation months later.
“We have always looked up at the sky to predict droughts – but not with too much success,” said Professor van Dijk from the ANU Fenner School of Environment and Society.
“This new approach – by looking down from space and underground – opens up possibilities to prepare for drought with greater certainty. It will increase the amount of time available to manage the dire impacts of drought, such as bushfires and livestock losses.”
The drought forecasts will be combined with the latest satellite maps of vegetation flammability from the Australian Flammability Monitoring System at ANU to predict how the risk of uncontrollable bushfires will change over the coming months.
The team used the GRACE Follow-On satellites, which were developed by American, German and Australian scientists. ANU Professor Daniel Shaddock led the Australian team.
Dr Paul Tregoning from the ANU Research School of Earth Sciences said the GRACE space gravity mission provided a measurement of changes in total water storage anywhere on Earth for the first time.
“Combined with measurements of surface water and top soil moisture from other satellites, this provides the ability to know how much water is available at different depths below the soil,” he said.
“What is innovative and exciting about our work is that we have been able to quantify the available water more accurately than ever before. This leads to more accurate forecasts of vegetation state, as much as five months in advance.”
,
Read More » Posted in Satellite, Water | Comments Off on Space Technology Predicts Droughts Several Months In Advance
Courtesy of The New York Times, a report on the Environmental Defense Fund’s plans group to spend millions to launch a satellite that could help fight climate change by identifying methane leaks with pinpoint accuracy:
Tom Ingersoll, a longtime satellite entrepreneur, admits being startled by a call he received last year: A nonprofit foundation wanted to build a satellite and launch it into orbit to help fight climate change. “I thought, ‘Wow, that’s kind of crazy.’”
In February, he signed on as the project’s manager, after having taken a long look at the technologies required. “It’s hard, but we could probably pull it off,” he said.
Now the rest of the world can decide for itself. On Wednesday, Fred Krupp, the president of the Environmental Defense Fund, announced plans for MethaneSAT, an orbital eye in the sky that could monitor industrial methane leaks all over the planet.
Methane remains one of the thorniest climate problems. It is the major component of natural gas, which produces half the carbon dioxide of coal when burned to run electric plants. But when methane leaks, it is a potent greenhouse gas that traps more than 80 times as much heat as carbon dioxide in its first 20 years in the atmosphere. By some estimates, human-caused emissions of methane are thought to be responsible for about a quarter of the warming being experienced today.
But figuring out where methane emissions are coming from is a major challenge. The colorless, odorless gas has proved difficult to measure at the source of leaks without nearby access to the sites. Early attempts by the Environmental Protection Agency to determine the scope of the problem significantly underestimated emissions.
Methane leaks are relatively inexpensive to fix, and stopping leaks allows energy companies to sell more gas. The International Energy Agency has estimated that as much as 50 percent of the 84 million tons of methane emitted by the oil and gas industry every year — from leaky wells and pipes and other causes — “can be mitigated at no net cost, because the value of the captured methane could cover the abatement measures.”
The Environmental Defense Fund has worked for many years on methane issues; it organized a five-year, $20million research effort into leaks in the United States across the production and supply network. That research, which helped the E.P.A. adjust its national emissions estimates, involved local measurements from ground instruments and airplane flyovers. But such methods are not always feasible — or welcomed — in other countries.
To address the problem of finding leaks around the world, a recent report from the National Academy of Sciences called for methane monitoring from space, where international access is not a problem. “Satellite measurements are critical,” said David T. Allen, a professor of chemical engineering at the University of Texas who served on the committee that wrote the report. “Right now satellite measurements are one area in which we have very limited information.”
MethaneSAT, by comparison, is designed to detect emissions across the planet with sufficiently high resolution to identify sources. The organization plans to make the data publicly available so that companies, policymakers and regulators can take action.
Identifying major sources of leaks could help governments and industry coalitions work together to address the problem, said Daniel J. Jacob, a professor of atmospheric chemistry and environmental engineering at Harvard. “How can you do climate policy for methane if you don’t know where the sources are?” he said.
Mr. Krupp, the Environmental Defense Fund president, is announcing the initiative at the TED2018 conference in Vancouver, British Columbia. His organization has already obtained most of the “tens of millions of dollars” that building the satellite and launching it should cost, Mr. Krupp said in an interview. Much of the early money came from the Robertson Foundation, which has environmental work as part of its focus. The launch is planned for late 2020 or early 2021.
Space is a tough neighborhood; timetables slip and challenges proliferate. But the “new space” movement has helped move orbital launches out of the realm of superpowers and put it within the reach of businesses and nonprofits.
“I think this is entirely feasible,” said Peter Platzer, the chief executive of Spire Global, a satellite company, who was not involved with the MethaneSAT project but has talked with members of the team extensively.
The environmental group is also working with Steven C. Wofsy, a professor of atmospheric and environmental science at Harvard, and his colleagues to address the daunting technology challenge of creating an infrared spectrometer that can detect methane plumes on the Earth’s surface.
The lead scientist for a major methane-detecting satellite program applauded the idea. Ilse Aben, a senior scientist at the Netherlands Institute for Space Research, presented the first data this week from a European satellite launched in October with an instrument that can detect methane, but at lower spatial resolution. She said the Environmental Defense Fund’s plan was “really complementary to what we have now.”
Mr. Ingersoll, MethaneSAT’s project manager, said that some of the technologies to be incorporated into the satellite had been developed for defense purposes, so “it’s fun to see this technology broaden, and bring potentially very beneficial applications to society.”
Discussions and research on the project began in 2015, Mr. Krupp said, as a way to extend his group’s methane monitoring beyond North America. Since the 2016 election, the Trump administration and the E.P.A. administrator, Scott Pruitt, have tried to roll back Obama-era rulesintended to crack down on leaks.
“We now see an added urgency that this satellite will give us data from the United States — much of it won’t be available any other way, given the actions that Pruitt has taken,” Mr. Krupp said. “We can’t wait for Washington, especially not now.”
,
Read More » Posted in Satellite | Comments Off on An Eye in the Sky Could Detect Planet-Warming Plumes on the Ground
New technical innovations such as location-tracking devices, GPS and satellite communications, remote sensors, laser-imaging technologies, light detection and ranging” (LIDAR) sensing, high-resolution satellite imagery, digital mapping, advanced statistical analytical software and even biotechnology and synthetic biology are revolutionizing conservation in two key ways: first, by revealing the state of our world in unprecedented detail; and, second, by making available more data to more people in more places. The mission of this blog is to track these technical innovations that may give conservation the chance – for the first time – to keep up with, and even get ahead of, the planet’s most intractable environmental challenges. It will also examine the unintended consequences and moral hazards that the use of these new tools may cause.Read More