Courtesy of Nature, an article on how sharing big data from satellite imagery and other Earth observations across Asia, the Middle East, and east Africa is key to sustainability:
The ancient Silk Road trade routes connecting Asia, Europe and Africa lay behind the development of many great civilizations. Today, solar panels and smartphones have replaced silk, and trains and aeroplanes have superseded camels. But the Silk Road spirit of peace, mutual benefit and learning has been revived in an ambitious plan to bridge East and West, launched in 2013 by Chinese President Xi Jinping.
The ‘Belt and Road’ initiative promises more than US$1 trillion of Chinese investment in some 60 countries (see ‘Belt and Road’). All other nations are welcome to join in. The main aim is socio-economic development through improving the routes for land and sea trade. The initiative will also boost science and technology across the region, for example through research into artificial intelligence, nanotechnology, quantum computing and smart cities (see go.nature.com/2mvfec6).
But protecting the environment while supporting economic growth will be challenging. The Belt and Road region is home to more than 65% of the world’s population. It includes 18 cities that have populations of greater than 10 million, such as Beijing, Cairo, Moscow, Manila and Istanbul.
Environments are diverse and fragile. Conditions range from the snow, ice and permafrost of the Qinghai–Tibet Plateau to the forests and steppes of Russia and the deserts of Mongolia. Coasts and seas are threatened by rising sea levels, overfishing and pollution. Access to water is a big problem across central Asia. For example, the volume of water in the Aral Sea has shrunk by around 90% in the past 50 years, mainly because the sea and its rivers have been tapped for irrigation.
World Heritage Sites designated by the United Nations Educational, Scientific and Cultural Organization (UNESCO) are endangered by construction, logging, overexploitation and climate change. These include Sumatra’s tropical rainforests; Uzbekistan’s historic centre of Shakhrisyabz; and the world’s second-largest raised coral atoll, in the Solomon Islands at the eastern end of Rennell Island.
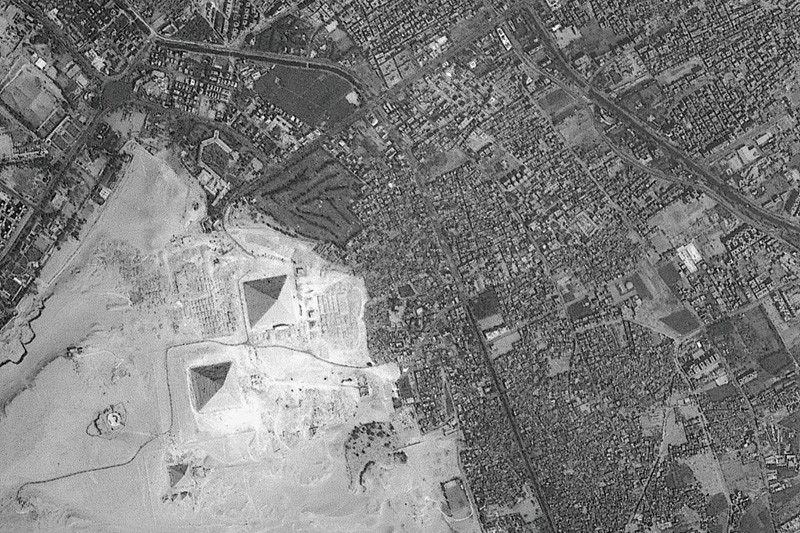
Development encroaches on the pyramids at Giza.Credit: ESA
The economies of many developing countries are rural, with agriculture accounting for more than 25% of gross domestic product. Often, more than 40% of a developing country’s workforce is involved in farming. Food supplies can be unreliable.
Natural hazards are another threat. Belt and Road nations experience about 85% of the world’s major earthquakes, tsunamis, typhoons, floods, droughts and heatwaves. For example, more than 86,000 people were killed or reported as missing in a massive earthquake in Wenchuan, China, in May 2008. And the 2004 Indian Ocean earthquake and tsunami killed hundreds of thousands of people. Seven of the top ten countries that saw major losses from disasters between 1995 and 2014 are in this region.
If we do nothing, sensitive environments will be lost and exposure to risks will rise.
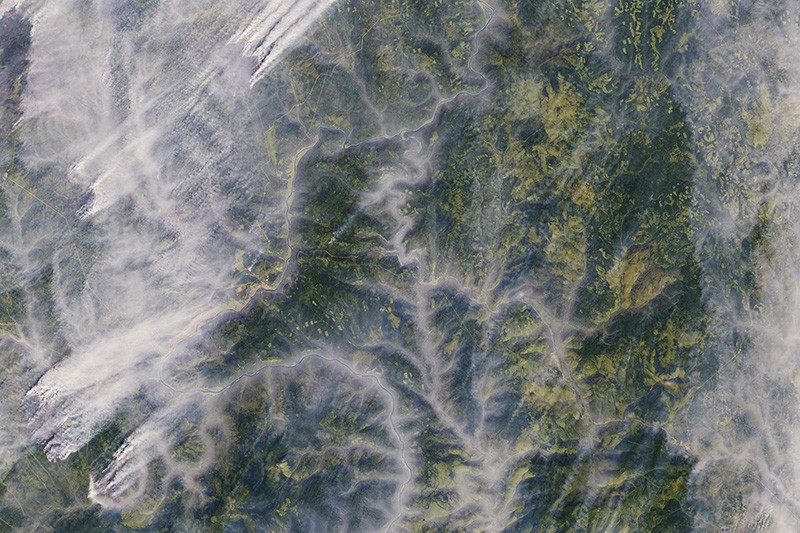
Wildfires threaten boreal forests in Russia.Credit: ESA
To address these problems, a combination of accurate, reliable and timely scientific observations of the state of terrestrial and marine ecosystems is essential — from space, the air and on the ground. However, coverage and infrastructure are poor. Many countries cannot afford to train experts in Earth-observing techniques or install ground stations to monitor soil nutrients or air quality. For example, Kyrgyzstan, Tajikistan, Turkmenistan and Uzbekistan have no Earth-observing satellites or facilities for mass data processing. Local data are rarely shared and are often locked away in government or university archives.
I chair the Digital Belt and Road Program (DBAR) initiated in 2016 by Chinese scientists in cooperation with experts from 19 countries and 7 international organizations. Our aim is to improve environmental monitoring, promote data sharing and support policymaking using big data on Earth observations. The Chinese Academy of Sciences (CAS) is investing more than 200 million yuan (US$32 million) in the next 5 years to support DBAR.
The programme will monitor different types of ecosystem and their evolution, including grasslands, forests, glaciers, urban areas, farmland and coastal regions. Environmental and socio-economic information will be shared through a platform for big Earth data, scheduled for roll-out between 2016 and 2026. This open-access gateway will allow researchers, policymakers and the public to track changes, development and trends. The programme will investigate indices and indicators to feed into the UN’s 2030 Sustainable Development Goals.
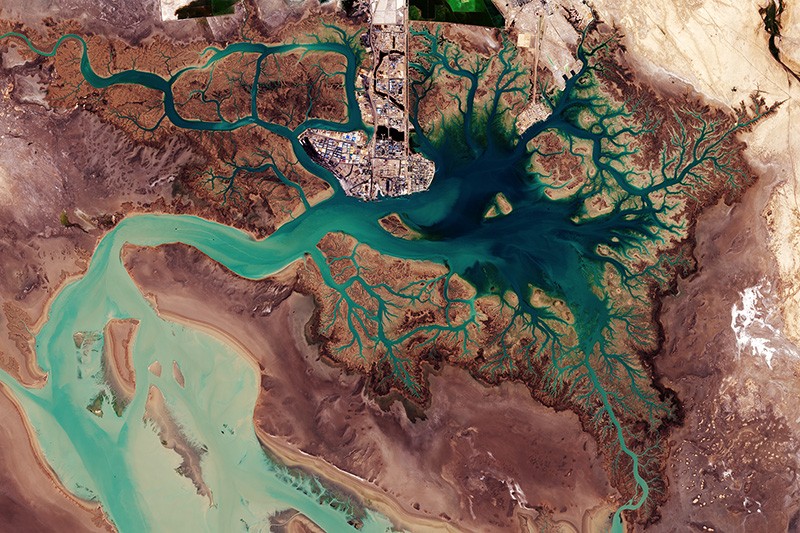
Musa Bay in Iran faces ecological damage from shipping.Credit: ESA
There are four main obstacles to a strategy on big Earth data for the Belt and Road region: poor access to data; a digital divide between developed and developing countries; a lack of awareness among some policymakers, local scientists and practitioners of the potential of Earth observations; and too little collaboration. These are long-standing problems — they also slowed emergency responses during and after the Indian Ocean tsunami in 2004, for example.
DBAR’s main approach is to work towards a platform that can handle a wide variety of information. Data sets and infrastructure are being assembled, and services should start to become available by the end of 2018. Eight key challenges are being targeted: adapting to climate and environmental change; mitigating disaster risk; managing water supplies; increasing agriculture and food security; protecting natural and cultural heritage; sustainable development of urban areas and infrastructure; managing coasts and marine areas; and understanding changes in high mountains and the Arctic.
For example, in agriculture, the main difficulty faced by most food-insecure countries of the region is a lack of up-to-date information about the supplies, yields and management of crops. DBAR is expanding the cloud-computing-based system CropWatch for monitoring and managing the availability of maize (corn), rice, wheat and soya-bean products. Launched by CAS in 1998, CropWatch provides users from 143 countries or regions with easy access to agricultural information.
For disaster relief and risk reduction, DBAR is developing a platform for sharing Earth-observation imagery. The value of such information in quickly assessing the impacts of extreme events has been proved in China and developed countries, and needs to be opened to others. For example, following the 2008 Wenchuan earthquake, Chinese rescuers were alerted to 700 people trapped in a village after seeing aerial imagery of “SOS700” written on top of a building.
The processes that shape urbanization need to be understood. Earth observations can reveal trends in the growth of cities and help planners to overcome traffic congestion, energy shortages, urban sprawl and poor basic services. For example, DBAR scientists are modelling the growth of Moscow to inform development in Beijing. The programme is also monitoring the impacts of some big infrastructure projects, including the Mombasa–Nairobi Standard Gauge Railway, Colombo Port City and the Malaysia–China Kuantan Industrial Park.
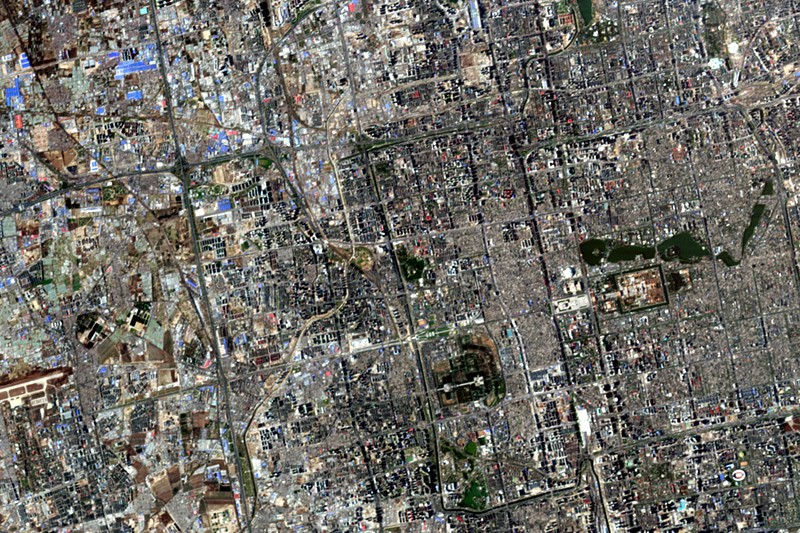
Beijing’s urban development can be tracked from space.Credit: ESA
The entire landscapes of World Heritage Sites — including human influences — need to be protected, not just their monuments2. For example, at Angkor in Cambodia, Earth observations that included airborne laser scans revealed the remains of multiple cities aged 900 to 1,400 years old lying beneath the tropical forest floor3. Deforestation and urban sprawl are the main risks that should inform a broader management strategy.
Way forward
We plan to focus on five priority areas at DBAR.
Enhance infrastructure. An open platform with shared data, codes and algorithms is urgently needed for analysing the vast amounts of Earth-observation data, which are already daunting and will only increase. The European Space Agency’s Sentinel-5P satellite, launched in October 2017, takes 20 million observations of air pollutants and gases each day — 10 times more than previous missions. Cloud computing must therefore be core4. It would currently take 1,200 years for one computer to process 3 million planetary-scale satellite scenes; a cloud-computing facility could do it in 45 days5. Earth-observing satellite data from upcoming missions will need to be incorporated.
Promote data sharing and interoperability. Data need to be openly exchanged if everyone in the region is to benefit. This will require decisions about suitable formats, information and support for handling them, as well as methodologies and tools to maximize exploitation of the data.
Extend applications to more people. Development across the Belt and Road region is uneven. To close these gaps, it is necessary to improve common solutions provided by big Earth data6. Access to tools such as CropWatch needs to be extended. Use of the digital cloud can allow anyone to access services anywhere across the region, and to accelerate the development of applications for various users.
Identify research opportunities. Knowledge could be discovered within the huge multidisciplinary data sets. For example, studying changes in the land surface of the Yellow River Delta from space over the past 40 years has increased our understanding of how its evolution depends on land use, precipitation and water flows. Researchers must help to raise awareness of the scientific potential and solutions provided by big Earth data, especially in less-developed countries.
To help bridge the technical divides between richer and poorer nations, DBAR should set up joint programmes, laboratories and international centres of excellence for gathering experts from participating countries. The programme has already established eight centres of excellence, in Pakistan, Thailand, Finland, Italy, Russia, Morocco, Zambia and the United States.
DBAR has embarked on an ambitious journey to build a digital Silk Road for sustainable development — we invite even more natural and social scientists to join this shared endeavour.
Via GreenBiz, a look at how satellite imagery is transforming conservation science:
As recently as the 1980s, gray seals effectively were extinct on Cape Cod. So when researchers announced last week that the population there has recovered not to 15,000 gray seals, the previous official estimate, but to as many as 50,000, it was dramatic evidence of how quickly conservation sometimes can work.
But the researchers, writing in the journal BioScience, weren’t just interested in the seals. They also sought to demonstrate the rapidly evolving potential of satellites to count and monitor wildlife populations and to answer big questions about the natural world. That’s still news to many wildlife ecologists, according to senior author David W. Johnston, of Duke University’s Nicholas School of the Environment. Ecologists have been slow to incorporate satellite data in their work so far, in part because their training and culture are about going into the field to get to know their study subjects first hand. The perspective from outer space has not necessarily seemed all that relevant.
But the rapidly growing abundance and sophistication of satellite imagery and remote sensing data is about to change that: “High-resolution earth imagery sources represent rich, underutilized troves of information about marine and terrestrial wildlife populations,” Johnston and his co-authors write. They urge wildlife ecologists to embrace satellite imagery “as a legitimate data source that can supplement and even supplant traditional methods.”
Among other promising developments, they note, satellite imagery of the Earth is being collected “globally, frequently, and at increasingly relevant resolution.” It’s also becoming available in user-friendly formats thanks to a profusion of startup companies, including Planet, DigitalGlobe, Skybox Imaging (later purchased by Google and renamed Terra Bella), Urthecast and LAND INFO Worldwide Mapping.
In February, for instance, Planet deployed 88 breadloaf-size satellites from an Indian Space Research Organisation rocket. They are now part of a 149-satellite constellation scanning every point on Earth several times a week. The primary focus is on commercial applications — for instance, tracking corn yields in Iowa, or how many cars are parked in the Walmart lot today. But the image frequency also has begun to enable rapid detection of deforestation, illegal mining and other changes in the landscape, as well as more efficient and accurate counting of wildlife populations.
NASA is also part of this trend. In 2019, it plans to launch a mission called GEDI (the Global Ecosystem Dynamics Investigation) using lidar, a laser-based remote sensing technology already familiar to ecologists for mapping 3-D vegetation structure from airplanes. This time, from the International Space Station, GEDI will enable scientists to determine the height and structure of the forest in any given location and precisely map aboveground biomass and carbon storage — all without applying for grants to hire an airplane or spending days flying transects.
GEDI also will make it possible, according to the University of Maryland’s Ralph Dubayah, principal investigator on the mission, “to estimate the net impact of deforestation and subsequent regrowth of forests, and to provide information critical for preserving and promoting habitat quality and biodiversity.” The technology should prove useful for monitoring commitments made by nations under REDD (the program to reduce emissions from deforestation and forest degradation) as well as under the Paris climate accord and the Convention on Biological Diversity. In addition, it will improve weather and climate modeling and provide detailed measurement of temperate glaciers, lakes and rivers for better management of water resources.
Ecologists “are going to have this epiphany,” said Johnston, as they begin to understand the potential of these new tools. It happened for him a few years ago while giving an undergraduate lecture about the movements of radio-tagged seals on Cape Cod. “We have tags on live animals, and it’s really great for students,” he said. “They can check in every day on where a particular seal is traveling. I was loading data on Google Earth, and just zoomed right in to see where this seal turned up, and lo and behold, the image was good enough to count seals on the beach. I looked and said, ‘Hey, we could probably count the Cape Cod seal population this way,’ and at the end of class, three students came up to say they’d like to do that.”
The seals commonly use beaches as summertime “haul-outs,” and in the past, the National Oceanic and Atmospheric Administration (NOAA) has counted them in the traditional fashion, by flying over the beach and taking photographs. But NOAA never got around to publishing all the resulting data, to the frustration of other researchers, said Johnston, and it also “never worked to correct the beach count for the number of animals at sea.”
Pacific Northwest National Laboratory
Scientists use images like this of a delta in Alaska’s North Slope to look through ice and water and assess the impact of oil development.
Satellite images freed the researchers from dependence on the NOAA data. And data from their own long-term radio-tagging study, showing how much time seals spend typically at sea in a given day or season, allowed the researchers to develop an algorithm for calculating the total population, rather than just the part visible on the beach.
Douglas McCauley, a marine biologist at the University of California Santa Barbara, praises the new study for bringing the potential of satellite-based wildlife research “home to our own backyards,” on a question with major management implications. For Cape Cod vacationers feeling that a seal haul-out has crowded them off a favorite beach, or for fishermen losing their catch to seals, news that 50,000 gray seals are now on the Cape is likely to sound like an invasion.
For conservationists, on the other hand, it may not even represent recovery to the original population level. The long-running debate about the seals can become highly emotional. An accurate count is the essential starting point for deciding among such management options as keeping hands off, paying for a contraceptive darting program, authorizing nonlethal harassment or even beginning to cull seals. “This is placing satellite data front and center in wildlife management,” said McCauley.
Beyond counting populations, satellites also have the potential to answer bigger wildlife behavioral questions. McCauley’s lab is using satellite data, for instance, to determine how wildebeests in the Serengeti exploit the habitat. “You can take one satellite image and you can sense the productivity — where the grass is greenest — based on reflectance patterns. And you can create a layer showing where all the wildebeests are, and see if they are tracking the productivity of the environment well.”
Another overlay factors in the “landscape of risk,” he said — a predator attack is more likely on the edge of a forest, or near one of the rock outcrops called kopjes, or at a watering hole. “Then you can ask how all that maps onto the migration corridor” to understand the importance of protected areas, especially in the face of increasing human development. Over the years, McCauley’s team and collaborators at the University of Glasgow have tracked several dozen wildebeests using radio collars. “This year, we don’t want to track two more,” he said. “We want to track 200,000” via satellite.
McCauley describes the rapidly improving view from outer space as “a macroscope.” It also should be a major boost for dwindling conservation program budgets, because the data is often available at no cost — and at much less risk for the researchers. In a study of U.S. biologists killed during research or management work from 1937 to 2000, two-thirds died as a result of air accidents.
“I don’t think we are ever going to get away from people in airplanes doing some biology,” said Johnston. “But for things that are especially dangerous, like over the water,” or in remote polar regions, satellite images are at least as good.
So why haven’t more wildlife researchers rushed to take advantage of satellite data? Partly because of scientific fiefdoms, said Nathalie Pettorelli of the Zoological Society of London: “Biological tradition is built on going outside and working with species. But the development of remote sensors and the use of satellite data have mainly happened in geography departments. Those two disciplines haven’t been used to working together. They don’t share common terminologies. A remote sensing expert will tell you about land cover, and a biologist will tell you about ecosystems. So you have to reconcile those viewpoints.”
When Pettorelli first turned to satellite data to help determine how environmental change is affecting biodiversity and ecosystem services, biologists told her it was a bad idea. “There are people who don’t trust satellite data,” she said. They consider it “competition with ground data,” although in reality satellite and ground data often enhance each other, as happened with the Cape Cod seals. Meanwhile, the remote sensing experts “were telling me it’s too complex; you need to hire somebody. I didn’t have money to hire somebody, and I just learned more and more how to do it myself.”
Lack of training remains an obstacle to broader reliance on satellite data, she says, “particularly in developing countries where people could get the most out of it, where there is no money for large on-the-ground studies,” or for airplane surveys. “But for the moment a lot of biologists have no idea what remote sensing is, how to get the data, how to use the data.”
That lack of familiarity with the nuances of satellite data is also an impediment at the global level, said Pettorelli. Under the Convention on Biological Diversity, the 196 party nations have a series of targets to achieve by 2020 for the conservation of protected areas and the protection of plant and wildlife diversity. The only way to monitor progress in a timely and economical way is by satellite, said Pettorelli. But with just three years to go, participants still haven’t even agreed on which space-based indicators to rely on. Building trust in satellite data among her fellow biologists remains a painfully slow process.
,
Read More » Posted in Satellite | Comments Off on How Satellite Imagery Is Transforming Conservation Science
Via Third Pole, a look at how – using data from NASA – Pakistan’s water research agency is sending rain forecasts to 10,000 farmers, helping them to irrigate more efficiently and increase their crop yields:
It is still beyond farmer Mohammad Ashraf’s comprehension that people in Islamabad can predict that it will rain in the next two days in his village. He is also astonished that, based on this prediction, they can tell him how much he should water his rice and sugarcane plantations.
“I marvel at this science of being able to predict something that is unknown and in God’s hands,” says the 36-year-old farmer, Every Friday, he reads the simple Urdu messages sent to his phone, saying things like: “Dear farmer friend, this is to inform you that between 21 and 28 July 2017 in your area (Bahawalnagar) the crops used this much water (cotton 1.6 inch, sugarcane 1.7 inch). Next week, rain is predicted in some parts of your region. Therefore please water your crops accordingly.”
The text messages (or SMS) are sent by the Pakistan Council of Research in Water Resources (PCRWR), a government agency that carries out water research. Ashraf would be even more flabbergasted if he knew the scientists get this information from space.
“Using satellites and models that take the pulse of the earth, we can identify the amount of water a given crop requires at a specific location and a specific time,” says Faisal Hossain, head of the Sustainability, Satellites, Water, and Environment (SASWE) research group at the University of Washington which developed the programme for, “estimating crop water requirement in a cost effective and sustainable manner for the whole country”.
Ashraf, who lives in Hayatpur in Punjab’s Sargodha district, now takes these messages seriously. Five years ago, he met water experts from the PCRWR who were doing a field survey to explore how to improve groundwater conservation and crop yield. During their surveys, the experts found that farmers were over-watering their crops. They installed a water meter on Ashraf’s 12-acre farm and explained that if the arrow turned towards the green on the dial, it meant that his land had enough water. When the arrow turned towards the red mark, it was time to water.
“Like every farmer in the village, I did not believe them. We have been farming for generations and know what works and what doesn’t,” Ashraf told thethirdpole.net. But the following year, he decided to only water his field when the marker pointed towards the red. That season he produced more, spent less on diesel to run the tubewell, and made more profit than anyone in the village. “The others watered their sugarcane fields three times more than I did and not only did my plants grow taller, I had less disease in my crop than the rest.”
Ashraf says that an acre of his land yielded 1,000 maunds (1 maund = 37 kilogrammes) of sugarcane. Each maund sold for PKR 180 (USD 1.70). “I sold my crop for PKR 180,000 (USD 1,700) while most villagers could only sell between PKR 80,000 and 100,000 (USD 755-944). Now a convert, he says he plans heed to every word from PCRWR. “I’d say that 99% of the time they are right on the mark about rain,” he says.
Since last year, the PCRWR has sent weekly information to farmers like Ashraf through text messages, telling them how much water their crops need. They also send them weather forecasts.
“We started with 700 farmers in April 2016, all across Pakistan, and since January this year the number of farmers receiving the messages has increased to 10,000,” says Ahmed Zeeshan Bhatti, deputy director of PCRWR. The agency has submitted a proposal to some organisations to support it in improving the advice and expanding the service to 100,000 farmers.
“We carried out a survey to gauge the response of the farmers to our advice and the feedback was encouraging,” he says. Between 25 and 30 farmers would call back immediately for further information. “Our initial telephone survey revealed that farmers are saving almost 40% of water by rationing irrigation,” he says, adding that the service is saving around 250 million cubic metres of irrigation water per year. In the next phase of the programme, the PCRWR wants to train the farmers, as well as those working in the agriculture department, to use research and the meteorological advice properly.
“I think the information they send is quite useful for us as by conserving water, our profit margins will be greater,” says 37-year old farmer Mohammad Tariq from Faisalabad. He, however, wishes for more types of information such as when to sow, when to spray with pesticides, how many times and what seed is good for which crop.
“Currently, we are totally dependent on whatever the sellers of agri-products tell us about using pesticides and seeds. We just accept whatever they say,” he says. “If it comes from the government agency, it would be authentic.”
“When the British designed the Indus Basin Irrigation System (IBIS) between 1847 to 1947, it was to turn 67% of the basin area into farmland,” said Azeem Shah, regional researcher at Lahore based International Water Management Institute.
Even after the British left in 1947, the government irrigation engineers have been adding new dams, barrages, link and branch canals to the old system. Today IBIS has three large dams, eighty five small dams, nineteen barrages, twelve inter-river link canals, forty-five canal commands and 0.7 million tube wells. Still, say experts, canal irrigation water efficiency can be increased from the current 33% up to 90% (in the developed countries) by repairing leakages in the system, smart metering and creating effective solutions for reducing the demand for water and at the same time increasing agricultural productivity.
Further, today, said Shah, the cropping intensity has increased by 150% compared to 1947 with farmers not wanting to leave any fallow land. They also cultivate two or three crops. “Over the last 70 years, the quantity of the water has remained the same but agriculture is competing with other sectors, such as industry, as well as the growing population,” says Shah. Today, says Shah, roughly 50% of irrigation needs are met by IBIS canals and 50% is extracted from the ground.
The SMS programme is supported technically and financially by the University of Washington’s Global Affairs Department, NASA’s applied sciences programme, the Ivanhoe Foundation and the Pakistan government. When it started, the PCRWR was providing week-old information, but is now able to forecast for the present and the future. Hossain points out, however, that even if long-term forecasts were not offered, short-term weather information would still have value. “Soil moisture has memory and inertia, so knowing how much it has rained and stayed in the soil the previous week is necessary to plan the coming week’s irrigation,” he explained.
The PCRWR is able to access global weather model forecasts with the help of the University of Washington, using a Chinese model and collaborating with the Pakistan Meteorological Department. “It is thus able to provide quite accurate information,” says Bhatti.
With Pakistan among many countries vulnerable to climate change and extreme weather conditions, using scientific methods to help farmers irrigate their land more efficiently is all the more necessary. Will this advice help farmers adapt to or fend off extreme climate phenomena in the years to come?
“That’s the idea,” says Bhatti, adding that the advice should help farmers tackle climate aberrations like heatwaves, and increased frequency of heavy and intense rainfall.
Hossain is a more cautious: “The skill of general circulation model projections – say into 2040 – is poor and of little empowering value to farmers. We are more focused on providing tactical information, rather than long-term strategic information for adaptation.”
Nor is this the only cellphone-based initiative taking place in Pakistan. In the province of Punjab, the Punjab Information Technology Board (PITB) along with the Agriculture Department of Punjab, is partnering with Telenor, a cellular company providing financial services to farmers who do not have bank accounts. “Not only are we providing interest free loans to smallholder farmers we are providing them advisories on how to improve their yield by using modern agriculture practices and linking them to agriculture experts, research institutions, agriculture extension workers and input providers,” said Uzair Shahid, senior programme manager at the PITB.
Step by small step, the farmers of Pakistan may end up seeing cellphone technology as an essential part of a more productive future.
,
Read More » Posted in Satellite, Water | Comments Off on Satellites And SMS Help Pakistan’s Farmers With Smart Irrigation
Via The Source, an interesting article on the use of satellite remote sensing techniques to assess changes in water quality:
Satellites have a long history, with the American writer, Edward Everett Hale, writing speculative fiction containing the first known depiction of an artificial satellite to measure longitude in The Brick Moon, back in 1869. During the intensity of World War II, the first space-based picture of Earth was taken, demonstrating the potential for space-based cameras to help us monitor our changing world. Soon after, space became the battlefield where the US and the Soviet Union tested their supremacy during the Cold War, giving way to, amongst others, the first commercial communications satellite. Today, from atmospheric satellites that can predict weather conditions to remote sensing satellites that monitor our environment’s resources from afar, there’s little on Earth’s surface that escapes from satellites’ sight. How can we apply satellite information to improve the quality of our waters and optimise decision making in water supply services?
Our freshwater resources are severely affected by climate change, urbanisation, population growth, and competing demands from other uses, such as ecosystem protection, agriculture, energy production and recreation. Water utilities’ treatment operations, costs, and the resulting services to consumers are heavily determined by both the quantity and quality of water upstream in the catchments and reservoirs.
Changes in climate are resulting in increased frequency and intensity of precipitation, topping up reservoirs, which can result in excess water runoff. This may lead to flooding and even destruction of the water stored, compromising water supplies.
Increased urbanisation also aggravates the quality of water bodies. The expansion of paved areas and increased urban runoff are major sources of water pollution in urban areas. Another big threat to water quality comes from diffuse pollution caused by intensive farming and its associated use of pesticides and fertilisers to feed an increasing population worldwide.
These increasing pressures pose additional challenges to water utilities, many of which already struggle to secure a reliable supply of safe and clean water. Having access to real-time and forecasted information about the conditions of water quality and quantity is essential to proactively manage upstream risks, improve responses to water incidents, or improve their operational efficiency and quality of their services.
SPACE-O integrates Earth Observations and in-situ monitoring with advanced hydrological, water quality models and ICT tools, into a powerful decision support system that will generate up-to-the-minute data, as well as forecasting of water flows and water quality data in reservoirs. This knowledge about the conditions in the ground, now and in the near future, will help optimise water treatment plant operations, and increase the responsiveness of water managers against incidences, such as algal blooms, droughts and floods.
“High resolution pictures from earth observation could assist our water company in knowing when it’s the best time to take water from the river when the water stored during winter isn’t enough to supply for the summer months, highly reducing our maintenance costs,” said Ingrid Keupers, Technical Director of De Watergroep, during one of the first project consultation meetings with water utility operators.
Ensuring uptake of the resulting products is indeed crucial to the philosophy of SPACE-O. The products are centered around a decision support system (DSS) which aims to make use of satellite date and other technical tools to help water operators make informed decisions around issues such as water quality in reservoirs. From the start, a series of consultations with utility operators has been undertaken to cater the products to users’ needs. This creates ownership and interest in application of the relevant tools to their operations. Utilities that are interested to learn more can contact info@space-o.eu, and follow all the latest developments on the project’s website and social media channels.
Via Raconteur, an interesting look at how mobilizing a global citizens’ watch over the oceans is helping to combat the crime of illegal fishing:
Fishing is not the obvious focus for a major project that features both a Hollywood star and the world’s most valuable brand. However, this is not just a tale about food – this is a modern-day, global crime story.
Fish stocks worldwide are getting squeezed by legitimate operations, but also illegal activity, explains Toby Middleton, programme director of the Marine Stewardship Council. “Globally, about a third of fish stocks are overfished,” he says. “But stocks fished to their sustainable limit have steadily increased over the past 15 years from 47 per cent to 58 per cent. However, between 11 and 26 million tonnes of fish are illegally caught every year.”
In response, September last year saw Leonardo DiCaprio and then-US Secretary of State John Kerry officially launch Global Fishing Watch. The platform provides a digital tool powered by Google that adds more than 22 million data points daily to help track fleets, and expose rogue and illegal activity harmful to ocean biodiversity and marine ecosystems.
GLOBAL COLLABORATION
The information is free to browse and available to anyone with an internet connection, from governments and NGOs, through fisheries, seafood suppliers and buyers, to journalists and private individuals anywhere around the world.
The input of activists, campaigners and other citizens concerned about overfishing is directly encouraged and enabled; in effect, the crowd is invited to help police the problem.
The most important element of success for the project among all our partnerships and stakeholders is a common goal of promoting transparency at sea
Fundamentally, though, it is not the technology itself that is unique, but the mix of partners in collaboration. Global Fishing Watch harnesses the technological muscle of digital mapping and big data in support of advocacy. It brings together expertise in satellite imagery and remote sensing from SkyTruth, with the internet and cloud platform capabilities of Google, plus the campaigning focus of Oceana, an international group formed to protect oceans. Funding partners include the Leonardo DiCaprio Foundation and Bloomberg Philanthropies.
Governments also have a key role to play in the project, not just with their political endorsement, but their data. Earlier this month, both Peru and Indonesia committed to publishing government-owned vessel tracking data on the platform, taking major steps towards fishing transparency.
Despite the complexity of managing such a multi-stakeholder project, however, the metrics of its success remain relatively simple, says Jacqueline Savitz, Oceana’s senior vice president for US oceans and Global Fishing Watch. “The success of Global Fishing Watch is best measured by the impacts it creates, impacts like assisting in getting a vessel fined for fishing illegally in a protected area or convincing a local community to protect its areas from encroaching fleets,” she says.
It is all about getting eyes on the problem, concludes Ms Savitz: “The most important element of success for the project among all our partnerships and stakeholders is a common goal of promoting transparency at sea. To restore fisheries and address problems like illegal fishing and overfishing, activities at sea need to be visible; the global community needs to see what is actually happening beyond the horizon. Only then can we effectively protect our oceans.”
Via Seed Daily, a look at an innovative use of satellite navigation re: water conservation:
Water conservation is a growing concern globally, and particularly for farmers in the USA, where decades of irrigating huge fields has depleted vital resources of fresh surface water and groundwater. An ESA spin-off that can help to preserve water supplies while guaranteeing crop irrigation is now undergoing final testing.
The ambitious plan of former ESA employee Javier Marti is to tackle irrigation overuse, based on a concept developed at the agency’s technology centre in the Netherlands: using reflected satellite navigation signals for remotely sensing the Earth’s surface.
Lying under eight states in the central US, the vast Ogallala aquifer supplies almost a third of the ground water for crop irrigation in the country – but a large portion of the aquifer, particularly in the states of New Mexico, Texas and Oklahoma, could dry up within a generation or two if no action is taken.
Two thirds of the aquifer’s water lies under Nebraska, making the state a focus for testing the approach that Javier’s company Divirod has developed.
Over the coming months, several farms will regulate and optimise their irrigation using the new technique to reduce water consumption.
“Our system compares reflected and direct satnav signals to reveal the moisture content of soil and crops,” explained Javier, Divirod’s CEO.
“We anticipate our system could save farmers around 30% in operating costs in terms of both water and energy. Crop yields depend on many factors, but we estimate we could also improve yields by 10-12%.”
Using satnav signals for remote sensing
Javier worked with ESA engineer Manuel Martin-Neira on the Agency’s SMOS soil moisture and ocean salinity satellite. Here, he got the idea of using reflected satnav signals from a project proposed by Manuel for remote sensing. Manuel proposed using the microwave signals to measure terrestrial features such as the topography of oceans.
“Satellites carrying altimeters that use radar can only measure along the line of flight, whereas I realised that using reflected satnav signals would let us take measurements from several different points,” explained Manuel.
Spin-off from space
“Javier and Manuel’s work resulted in three ESA patents for using reflected satnav signals, a breakthrough now available for developing new terrestrial applications,” said ESA Technology Transfer Programme officer Mercedes Sanchez Alvarez.
“It’s great to see that Javier has taken the same signal approach and used it in another manner to develop a practical system for ground measurements of surface soil moisture content, water levels in reservoirs, snowpack and wetlands, among other applications.”
Manuel added, “Although the principles of how SMOS measures soil moisture are different from the Divirod approach, both techniques provide essentially the same thing.
“But what is nice here is that satellite navigation itself is the focus of much development, so basing a soil moisture measurement system on it should enable cost-effective results.”
Javier explained that the key is how the satnav signals are processed. “Using satnav for remote sensing is not unique, but we have developed software that lets us measure variations across a huge field down to a resolution of around 5×5 m or less, using only one sensor on a pole in the centre of the field.
“For some applications we could reduce this resolution to below a square metre in the future.”
This detailed coverage can be integrated into irrigation systems so that water is delivered precisely to different areas across each field as required.
Sensors can also be built into the industrial centre pivot irrigation systems that are widely used across the USA and combined with machine learning to create a self-contained, closed-loop scheme.
Better cultivation in Nebraska
“I’m really excited about the prospect of using the Divirod technology to refine how we use water on our farm,” said Roric Paulman, owner of Paulman Farms in Nebraska, one of the initial trial sites.
“We’re sited in a water restriction management area now. Nebraska legislation recognises that the surface water and groundwater needs in the future are important to the sustainability of the aquifer.”
The alternative methods of assessing soil moisture are physical probes and satellite images. However, a probe measures only the value at one point, and extrapolating from that can be complicated by the different soil types, slopes and varying ground elevation – even across a single field.
“The problems with satellite imagery are not only resolution and cost, but also the time it takes to gather the data and translate it into a setting for the irrigation tool. This can take days, but on a farm we’re working in real time,” added Roric.
Towards efficient water use
Divirod is carrying out sensor tests at the University of Nebraska’s Lincoln Experiment Station to confirm the sensor measurements. It will also be one of the technologies investigated by the Ogallala Water Coordinated Agriculture Project, which may involve thousands of sensors.
Although agriculture is a focus for Divirod, the company is already exploring other applications. From May, sensors will be tested at two sites in Boulder, Colorado, for their potential for moderating water usage in municipal landscapes. There has also been interest from the Middle East. A provisional patent has been filed and more could follow.
New technical innovations such as location-tracking devices, GPS and satellite communications, remote sensors, laser-imaging technologies, light detection and ranging” (LIDAR) sensing, high-resolution satellite imagery, digital mapping, advanced statistical analytical software and even biotechnology and synthetic biology are revolutionizing conservation in two key ways: first, by revealing the state of our world in unprecedented detail; and, second, by making available more data to more people in more places. The mission of this blog is to track these technical innovations that may give conservation the chance – for the first time – to keep up with, and even get ahead of, the planet’s most intractable environmental challenges. It will also examine the unintended consequences and moral hazards that the use of these new tools may cause.Read More